Module 2.1 – Simple Random Test
March 29, 2018
Background
Using VibrationVIEW
Laboratory Exercises
Reference
Back to: VibrationVIEW Syllabus
Use the Hardware, Inputs, and System Limits configuration from Module 1.1.
1. Create a Simple Random Test
a. Select New Test > Random.
b. Create a breakpoint table as displayed in the image below:
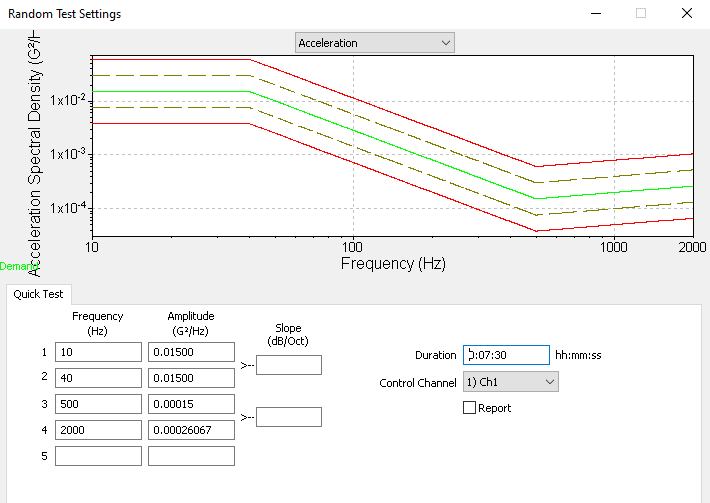
Frequency (Hz)
10
40
500
2000
Amplitude (G2/Hz)
0.01500
0.01500
0.00015
0.00026067
c. Set the duration to 7 m 30 s (7 minutes and 30 seconds).
d. Select OK, accept the changes, and save the test as Name_SimpleRandom.
2. Create the Graphs
a. Select New Graph.
b. Graph 1 configuration
- Graph Type: Acceleration vs. Freq. (acceleration spectral density)
- Control Loop Traces:
- Input Channels: Ch1 and Ch2
- Select Show only active lines
c. Graph 2 configuration
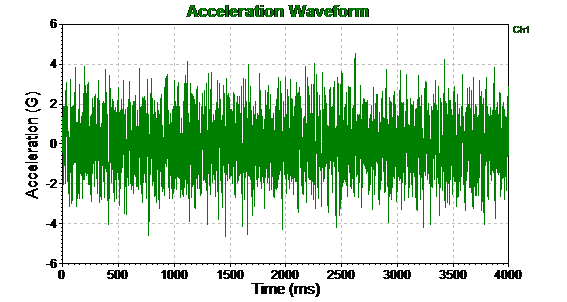
- Graph Type: Acceleration Waveform
- Input Channels: Ch1
d. Graph 3 configuration
- Graph Type: Transmissibility vs. Freq.
- Reference: Ch1
- Input Channels: Ch2
- Select Show only active lines
e. Graph 4 configuration
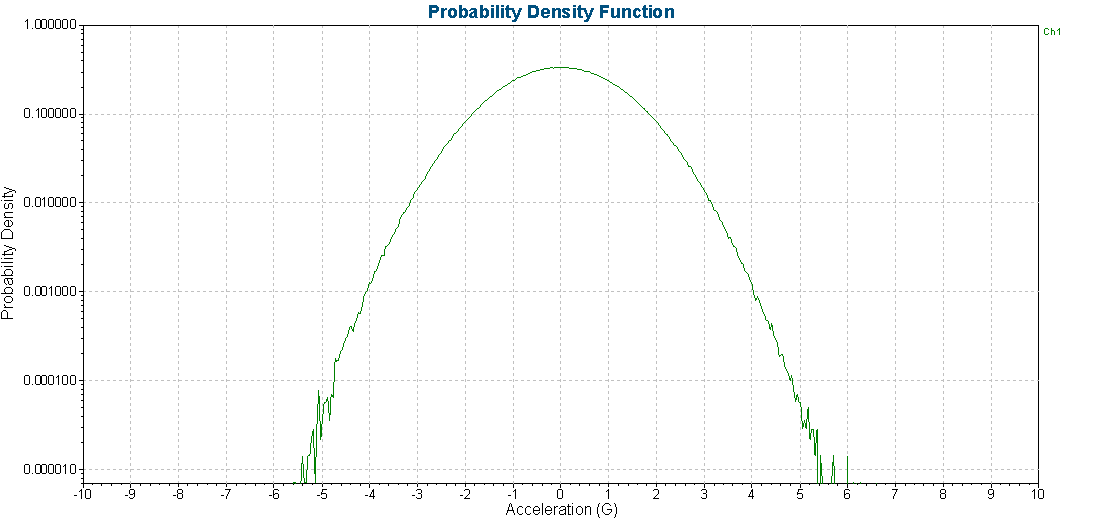
- Graph Type: Probability Density
- Point to Axis Limits and change the y-axis to Log
- Input Channels: Ch1
f. Select OK.
3. Run the Test
a. While the test is running, watch and listen for the differences between a sine test and a random test. Do you still observe a resonance?
b. Save the data.
4. Create a Report
a. Select Report.
b. In the report, include the following information:
- VibrationVIEW Screen
- Acceleration Waveform
- Breakpoint Table
- Accelerometer calibration details
- Channel Measurements
Your report should look like the following:
Breakpoint Table
| Frequency | 10Hz | 40Hz | 500Hz | 2,000Hz |
| G²/Hz | 0.015 | 0.015 | 0.00015 | 0.0002607 |
| dB/Octave | 0 | -5.489 | 1.2 |
Channel Measurements
| Overall | InBand | |
| Ch 1 | 1.191 G RMS | 1.19 G RMS |
| Ch 2 | 1.19 G RMS | 1.189 G RMS |
| Ch 3 | 1.826 G RMS | 1.826 G RMS |
| Ch 4 | 1.6 G RMS | 1.599 G RMS |
c. Copy the probability density graph and paste it onto your report. The PDF shows the distribution of the accelerations of the shaker. In this case, much of the acceleration is in the ±1 G range. This corresponds with the acceleration waveform graph.
d. What do you hear while the test is running? The sound is a molded “white noise.” There is no particular frequency or pitch, just a static sound.