
Module 1.3 – Advanced SRTD
March 29, 2018
Background
Using VibrationVIEW
Laboratory Exercises
Reference
Back to: VibrationVIEW Syllabus
Use the Hardware, Inputs, and System Limits configuration from Module 1.1.
1. Create an Advanced SRTD Test
a. Select New Test > Sine.
b. At the bottom of the Sine Test Settings dialog box, select the Advanced button.
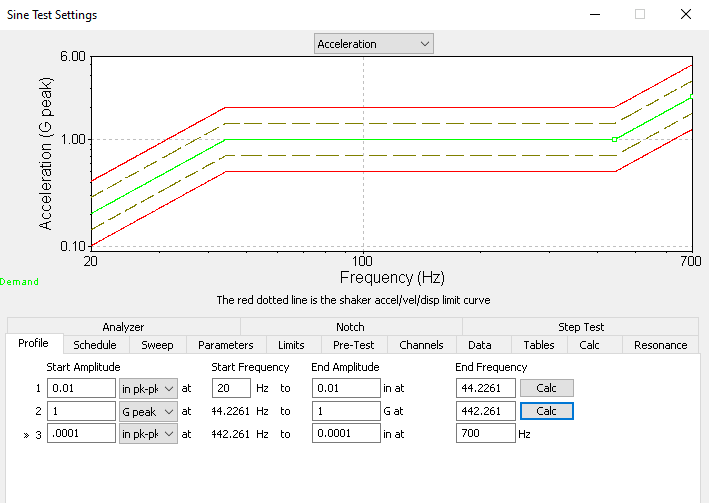
c. Select the Profile tab and enter the following configuration:
- Line 1
- Starting Amplitude: 0.01 in pk-pk at 20 Hz
- Ending Amplitude: 0.01 in pk-pk at 100 Hz
Select the Insert button to add a new line.
- Line 2
- Starting Amplitude: 1 G at 100 Hz
- Ending Amplitude: 1 G at 200 Hz
Select the Calc button to the right of Line 1; this will create a smooth transition between steps and will change the end frequency of the first step. Accept the changes and select Insert.
- Line 3
- Starting Amplitude: 0.0001 in pk-pk at 200 Hz
- Ending Amplitude: 0.0001 in pk-pk at 700 Hz
Select Calc to the right of Line 2 and accept the changes.
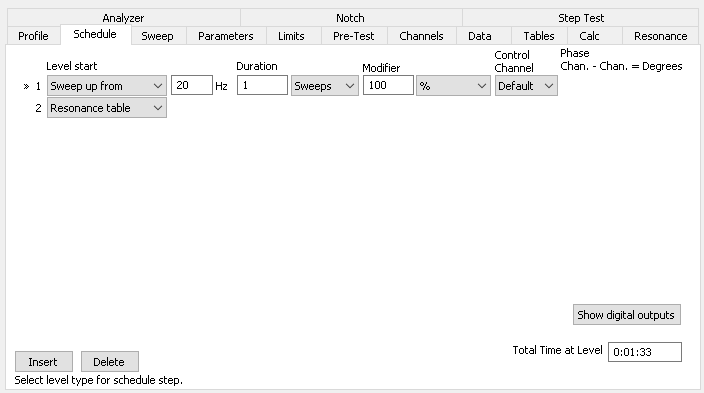
d. Select the Schedule tab and enter the following configuration:
- Line 1:
- Sweep up from 20 Hz for 1 sweep with 100% modifier
Select Insert.
- Line 2:
- Select Resonance Table from the dropdown box
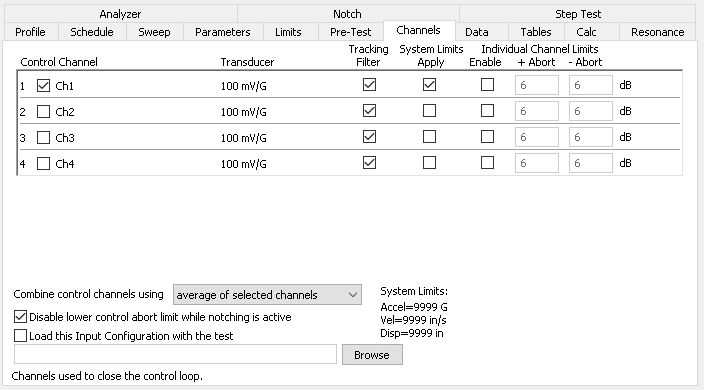
e. Select the Channels tab and enter the following configuration:
- Set Ch1 as the control channel
- Select System Limits Apply
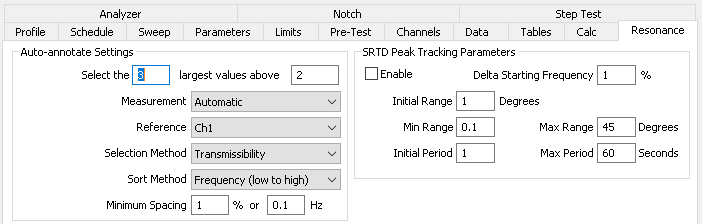
f. Select the Resonance tab and make sure the program is set to select the 3 largest values above 2.
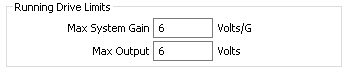
g. Select the Limits tab and point to Running Drive Limits.
- Max system gain: 6 V/G
- Max output: 6 V
h. Review the parameters and select OK.
i. Save the test as Name_AdvancedSRTD1.
2. Create the Graphs
a. Select New Graph.
b. Graph 1 configuration
- Graph Type: Acceleration vs. Freq.
- Graph Traces:
- Control Loop Traces: Demand, Control, Tolerance, Abort
- Input Channels: Ch1, Ch2
c. Graph 2 configuration
- Graph Type: Transmissibility vs. Freq.
- Graph Traces:
- Reference: Ch1
- Input Channels: Ch1, Ch2
3. Run the Test
4. Run the Selected Tones
a. When the test is finished, a Select Resonance Frequencies dialog box will appear.
b. Dwell at resonance 3 (approximately 497 Hz) for 3 minutes.
c. Select Phase Tracking to the right of the resonance.
d. Select Run Selected Tones.
5. SRTD Controls
a. While the test is running, select View > SRTD Controls.
b. Point to SRTD Controls and select the tau button.  Graphs associated with time will appear. Use the Phase Angle Adjustment Bar to change the phase angle. Observe the effects of the adjustment on the time graphs.
c. Select the theta button.  Graphs associated with the phase will appear. Use the Phase Angle Adjustment Bar to change the phase angle. Observe the effects of this adjustment on the phase graphs.