Module 1.1 – Simple Sine Test
March 29, 2018
Background
Using VibrationVIEW
Laboratory Exercises
Reference
Back to: VibrationVIEW Syllabus
For Demonstration mode only.
1. Configure the Inputs
a. Select Configuration > Inputs.
b. Set the sensitivity of Ch1, Ch2, Ch3, and Ch4 to 100 mV/g.
c. Select Apply.
For this example, we are selecting a high sensitivity to hear the test in Demonstration mode. The increased sensitivity will make the sound card’s rendition of the real-world test audible.
2. Configure the System Limits
a. Select the Limits tab.
b. Set the limits as displayed in the image below:
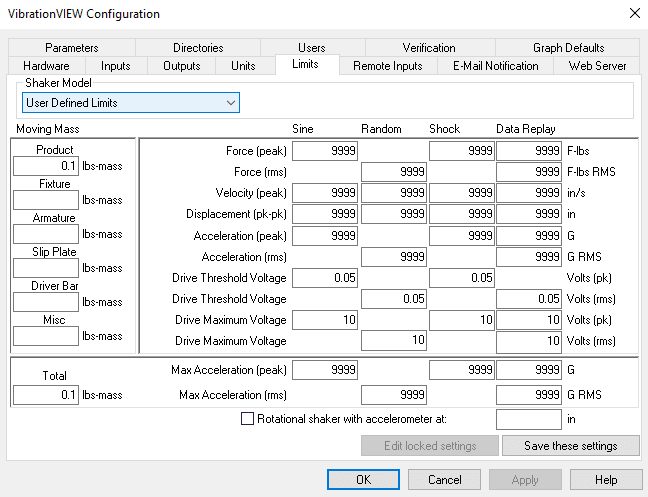
Force (peak)
Sine: 9999
Shock: 9999
Data Replay: 9999
Force (RMS)
Random: 9999
Data Replay: 9999
Velocity (peak)
Sine: 9999
Random: 9999
Shock: 9999
Data Replay: 9999
Displacement (pk-pk)
Sine: 9999
Random: 9999
Shock: 9999
Data Replay: 9999
Acceleration (peak)
Sine: 9999
Shock: 9999
Data Replay: 9999
Acceleration (RMS)
Random: 9999
Data Replay: 9999
Drive Threshold Voltage
Sine: 0.05
Random: 0.05
Shock: 0.05
Data Replay: 0.05
Drive Maximum Voltage
Sine: 10
Random: 10
Shock: 10
Data Replay: 10
Max Acceleration
Sine: 9999
Random: 9999
Shock: 9999
Data Replay: 9999
c. Select OK
3. Create a Simple Sine Test
a. In the main ribbon, select New Test > Sine.
b. Set the following test parameters:
- Frequency: 20 Hz to 2000 Hz
- Displacement:
- Sweep Rate: 3 Oct/min
- Duration: 1 sweep
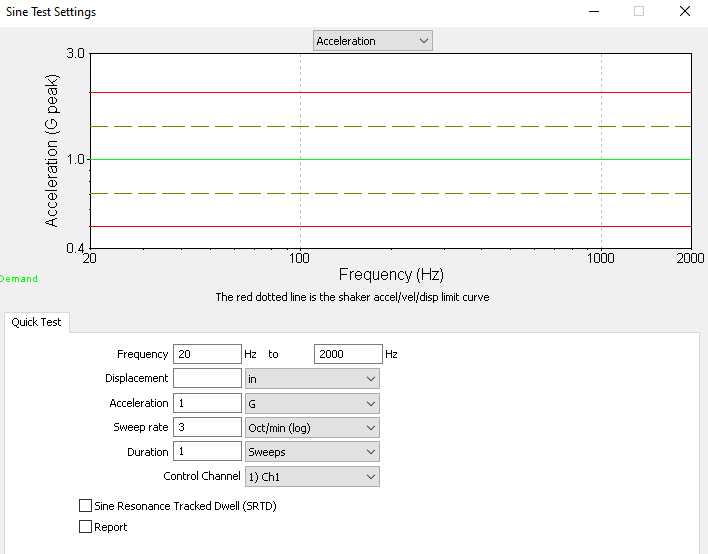
c. Select OK.
d. Save the test as Name_SimpleSine1.
4. Create the Graphs
a. Close any existing graphs.
b. In the main ribbon, select the New Graph button.

c. Graph 1 configuration
- Graph Type: Acceleration vs. Freq.
- Graph Traces:
- Control Loop Traces: Demand, Control, Tolerance, and Abort
- Input Channels: Ch1 and Ch2
d. Select the Insert Graph button.
![]()
e. Graph 2 configuration
- Graph Type: Acceleration Waveform
- Graph Traces:
- Input Channels: Ch1 and Ch2
f. Select Insert Graph.
g. Graph 3 configuration
- Graph Type: Displacement vs. Freq.
- Graph Traces:
- Control Loop Traces: Demand, Control, Tolerance, and Abort
- Input Channels: Ch1 and Ch2
h. Select OK.
i. In the main ribbon, select the Autoscale button (Ctrl+f).

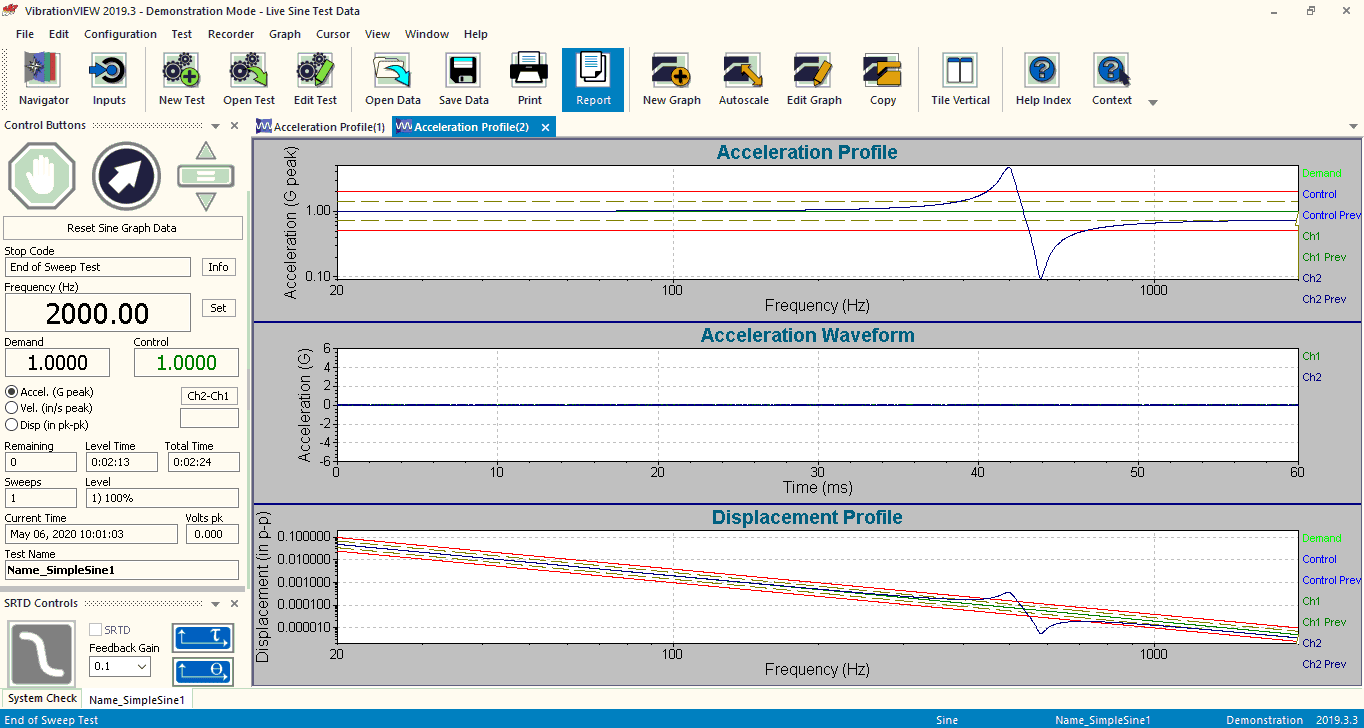
5. Run the Test
a. Select the Start the Test button.

b. Watch and listen while the test is running. You should hear the test as the frequency rises and visually observe the effects of the Sine test on the device under test (DUT).
c. After the Ch 2 resonance appears, select View > Cursor Window (CTRL+D) to view the resonances. Hover the cursor near resonance and press the shift key. The cursor will snap to the resonance. Continue holding the shift key and press the insert key. The annotation will be inserted at the “snapped to” peak.
c. Save the data in an appropriate location
6. Create a Report
a. In the main ribbon, select the Report button.

b. In the report, include the following information:
- Customer information: Name, Module Number, and Course Name
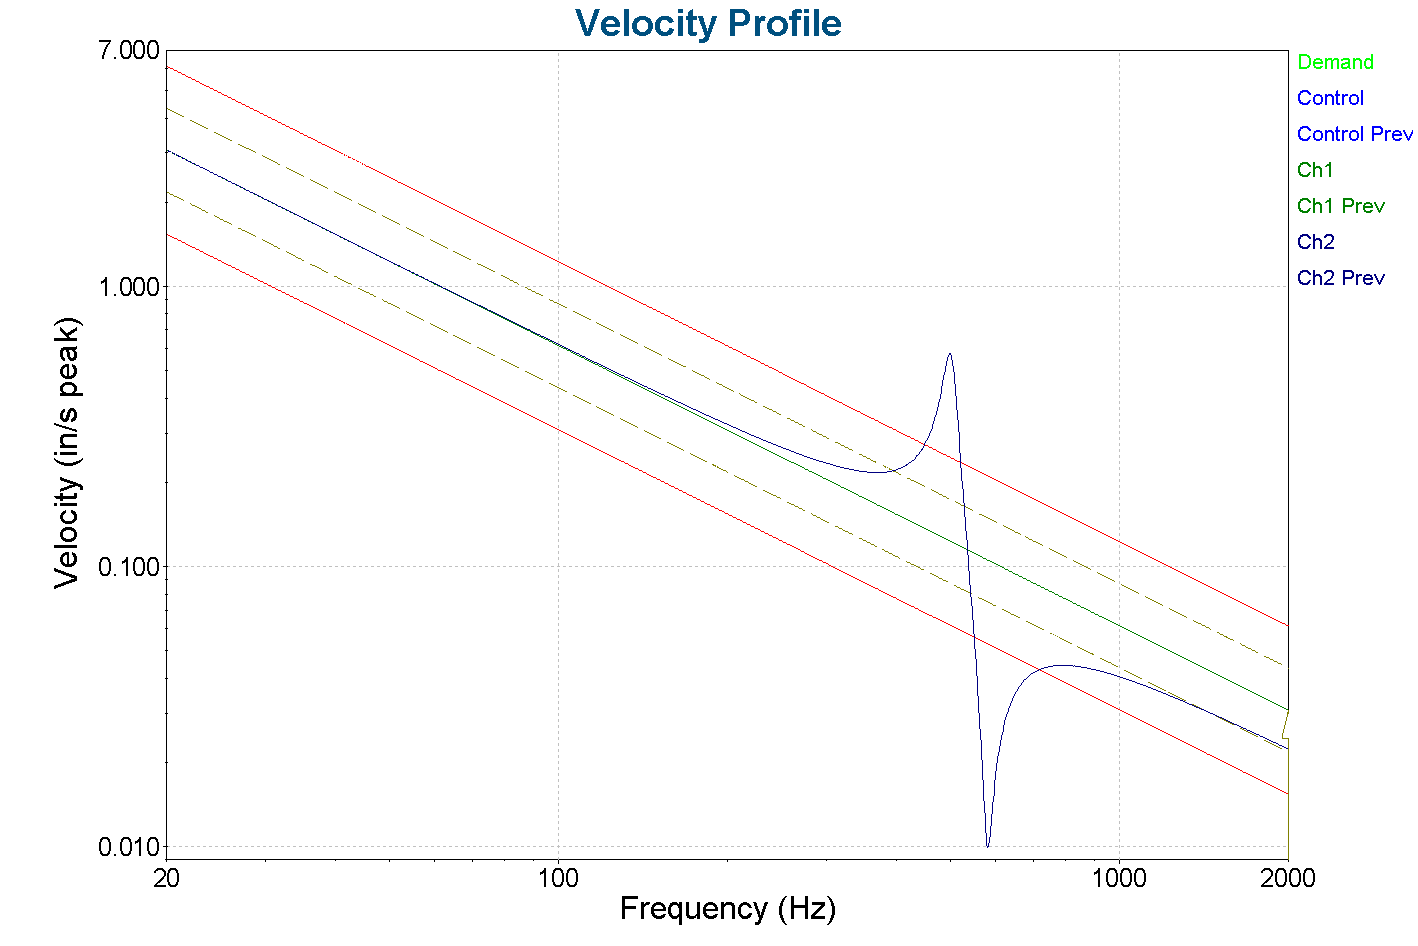
- Graphs:
- VibrationVIEW Screen
- Velocity
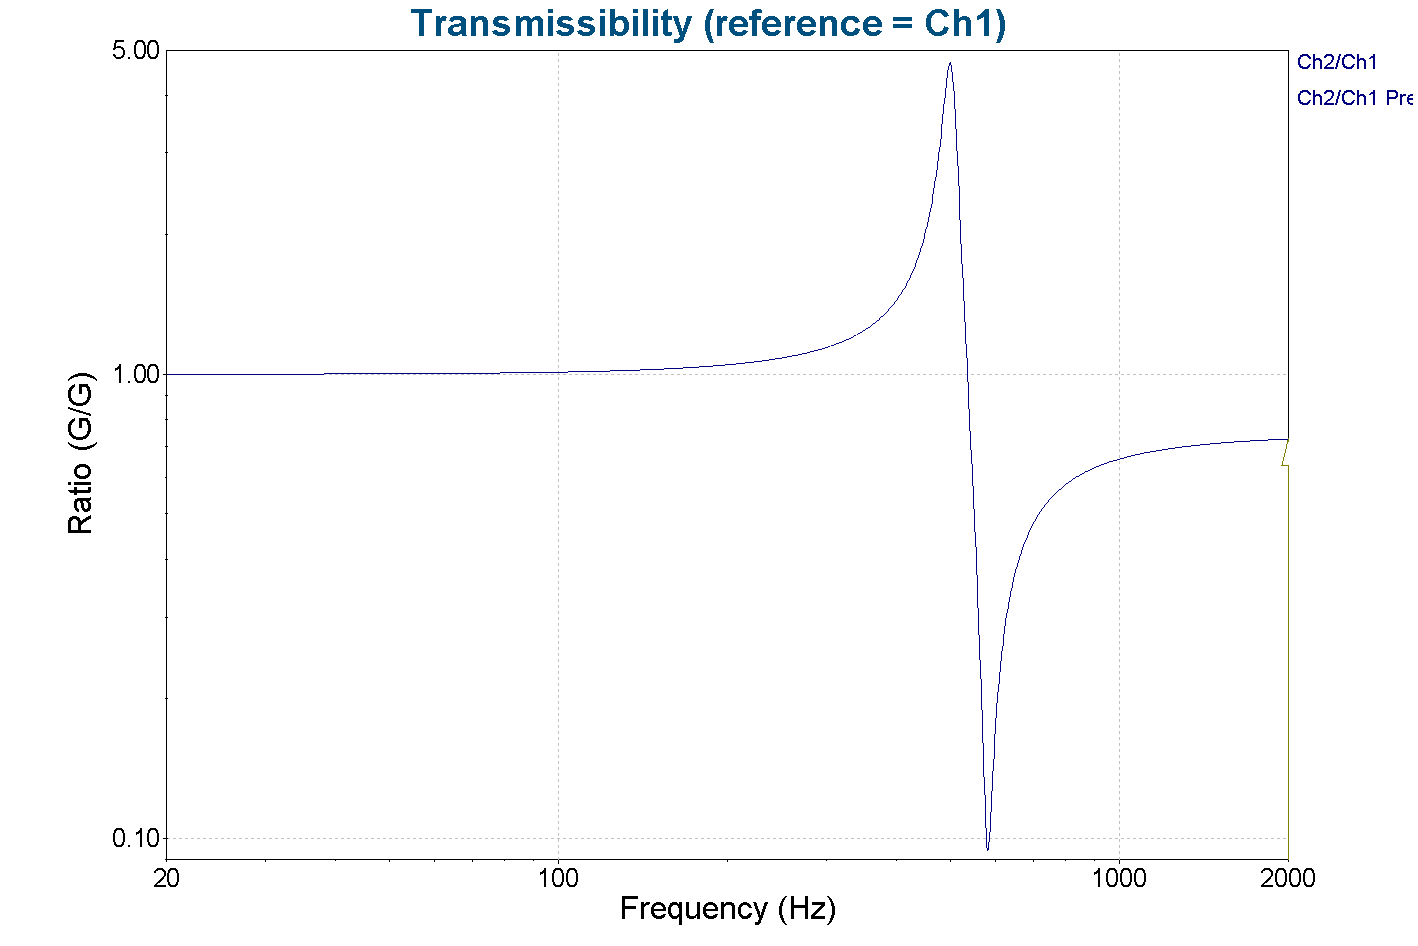
- Transmissibility
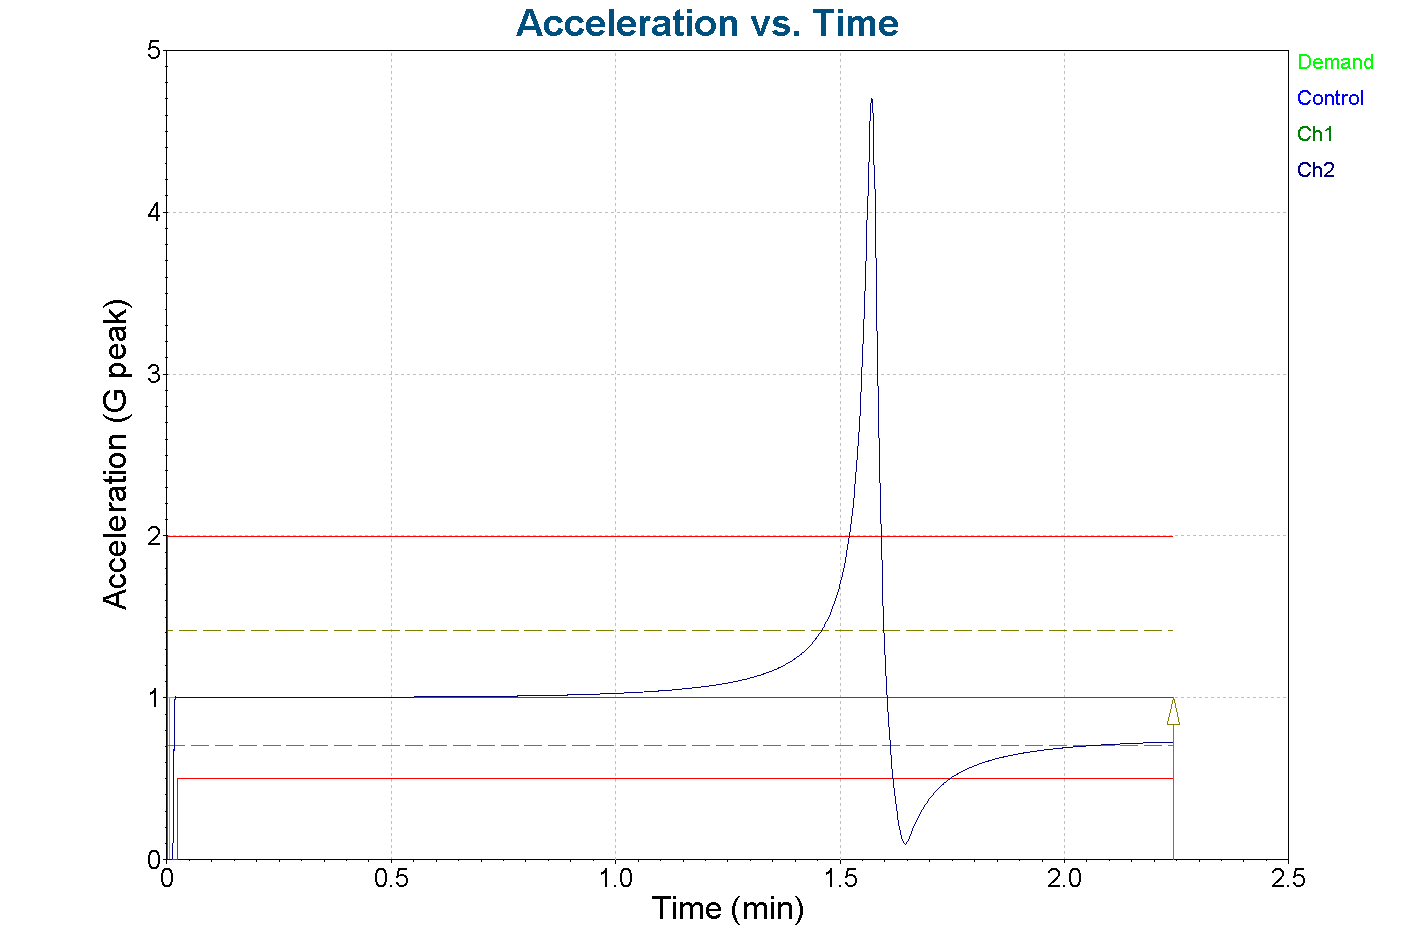
- Acceleration time history
- Demand, Control, Tolerance, and Abort
- Ch1 and Ch2
Your report should look like the following:
Breakpoint table
| Start Freq. | 20Hz |
| Amplitude | 1 G |
| End Freq. | 2,000Hz |
| Amplitude | 1 G |
Channel Measurements
Channel 1
| Acceleration | 1 G |
| Velocity | 0.03072 in/s |
| Displacement | 4.89e-06 in |
Channel 2
| Acceleration | 0.7261 G |
| Velocity | 0.03072 in/s |
| Displacement | 4.89e-06 in |