Module 1.2 – Simple Sine Resonance Tracked Dwell (SRTD)
March 29, 2018
Background
Using VibrationVIEW
Laboratory Exercises
Reference
Back to: VibrationVIEW Syllabus
Use the Hardware, Inputs, and System Limits configuration from Module 1.1.
1. Create a Simple Sine Resonance Tracked Dwell (SRTD) Test
a. Select New Test > Sine.
b. Set the following test parameters:
- Frequency: 20 Hz to 2000 Hz
- Displacement:
- Acceleration: 1 G
- Sweep Rate: 3 Oct/min
- Duration: 1 sweep
c. Select Sine Resonance Tracked Dwell (SRTD).
d. Select OK.
e. Save the test as Name_SimpleSRTD1.
2. Create the Graphs
a. Select New Graph.
b. Graph 1 configuration
- Graph Type: Acceleration vs. Freq.
- Graph Traces:
- Control Loop Traces: Demand, Control, Tolerance, Abort
- Input Channels: Ch1, Ch2, and Ch3
c. Graph 2 configuration
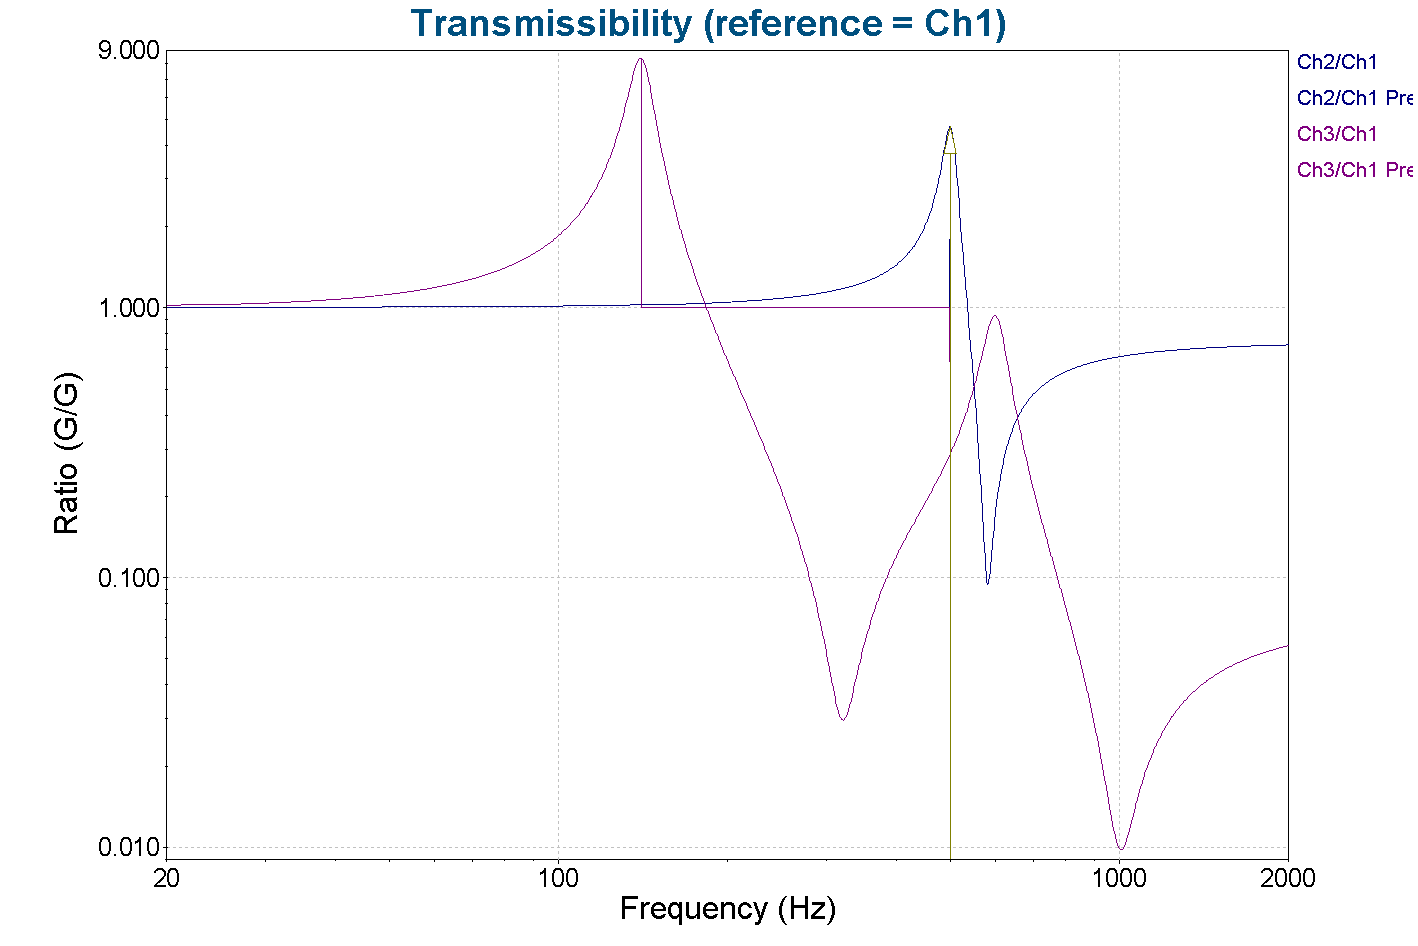
- Graph Type: Transmissibility vs. Freq.
- Graph Traces:
- Reference: Ch1
- Input Channels: Ch1, Ch2, and Ch3
3. Run the Test
a. Watch and listen while the test is running; you should hear the test as the frequency rises and visually observe multiple resonant frequencies on Ch2 and Ch3.
4. Run the Selected Tones
a. When the test is finished, a Select Resonance Frequencies dialog box will appear.
b. Select the first and second resonant frequencies; the first is approximately 140 Hz on Ch 3 and the second is approximately 499 Hz on Ch 2.
c. Change the duration to 5 minutes for each selected resonance.
d. Select the Run Selected Tones button.
e. While the test is running, select View > Graph Cursor (Ctrl+d) to view the resonances. Hover the cursor near resonance and press the shift key. The cursor will snap to the resonance. Continue holding the shift key and press the insert key. The annotation will be inserted at the “snapped to” peak.
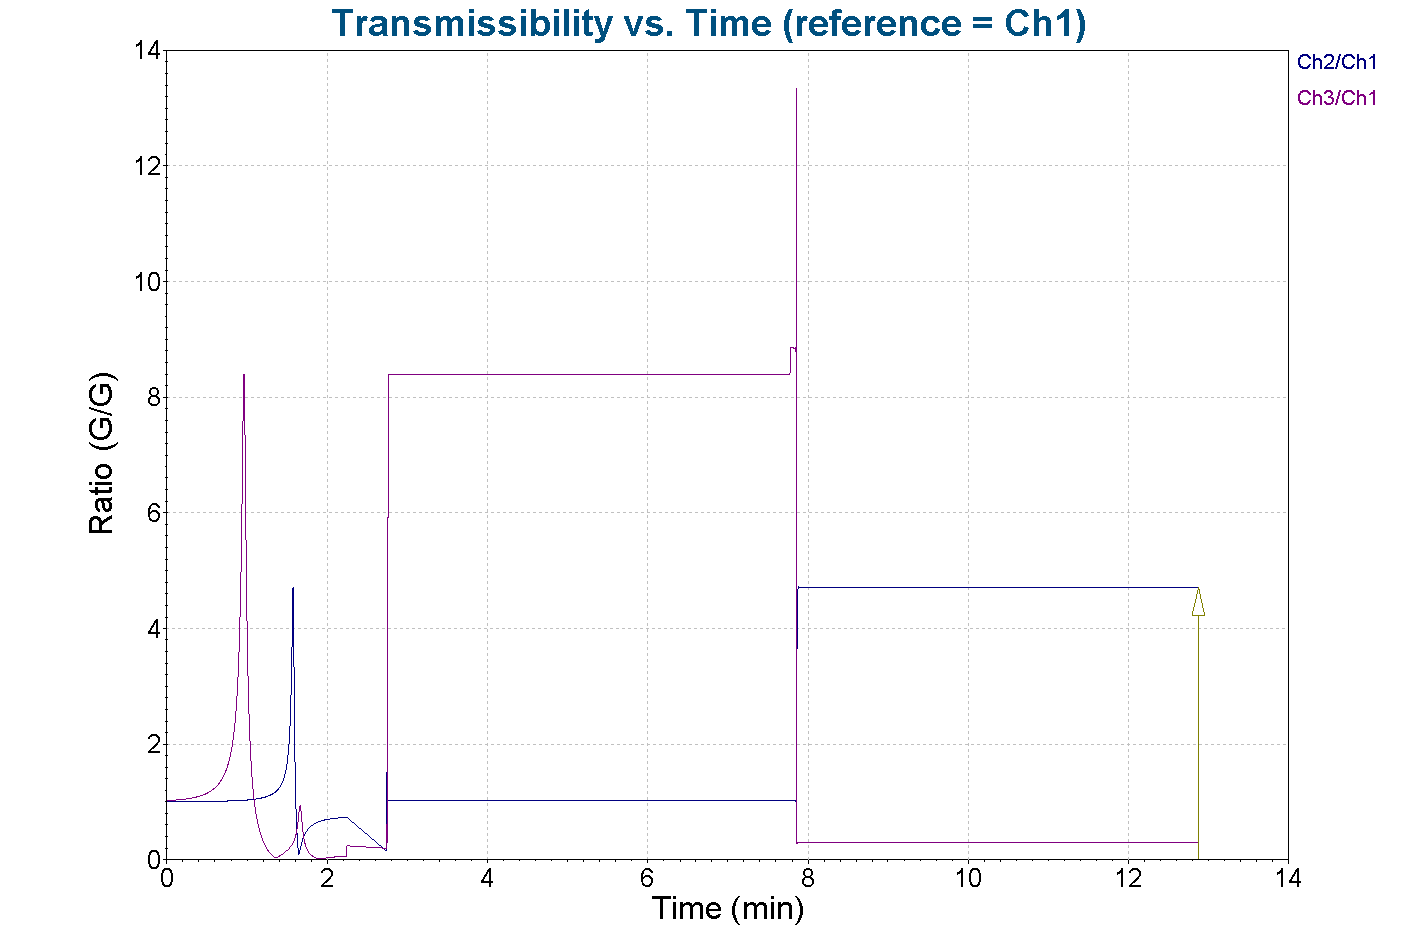
f. When the test is finished, the controller will automatically output a signal at the first resonant frequency for 5 minutes and then move to the second resonant frequency for 5 minutes.
5. Create a Report
a. Select Report.
b. In the report, include the following information:
- Customer information: Name, Module Number, and Course Name
- Graphs:
- Transmissibility
- Transmissibility time history
- Ch2 and Ch3
- Test Definition:
- Breakpoint Table
- Test Status:
- Accelerometer Calibration Details
- Channel Measurements
Your report should look like the following:
Breakpoint table
| Start Freq. | 20Hz |
| Amplitude | 1 G |
| End Freq. | 2,000Hz |
| Amplitude | 1 G |
Channel Measurements
Channel 1
| Acceleration | 1G |
| Velocity | 0.1232in/s |
| Displacement | 7.869e-05in |
Channel 2
| Acceleration | 4.714G |
| Velocity | 0.1232in/s |
| Displacement | 7.869e-05in |
Channel 3
| Acceleration | 0.289G |
| Velocity | 0.03561in/s |
| Displacement | 2.274e-05 in |
Channel 4
| Acceleration | 0.2211G |
| Velocity | 0.02725in/s |
| Displacement | 1.739e-05 in |