Module 5.1 – Shock Response Spectra (SRS) Test
March 29, 2018
Background
Using VibrationVIEW
Laboratory Exercises
Reference
Back to: VibrationVIEW Syllabus
Use the Hardware and System Limits configuration from Module 1.1.
1. Configure the Inputs
a. Select Configuration > Inputs.
b. Set the sensitivity of Ch1, Ch2, Ch3, and Ch4 to 1000 mV/g.
c. Select OK.
2. Create an SRS Test
a. Select New Test > Shock Response Spectrum.
b. Select Table and create a breakpoint table as displayed in the image below:
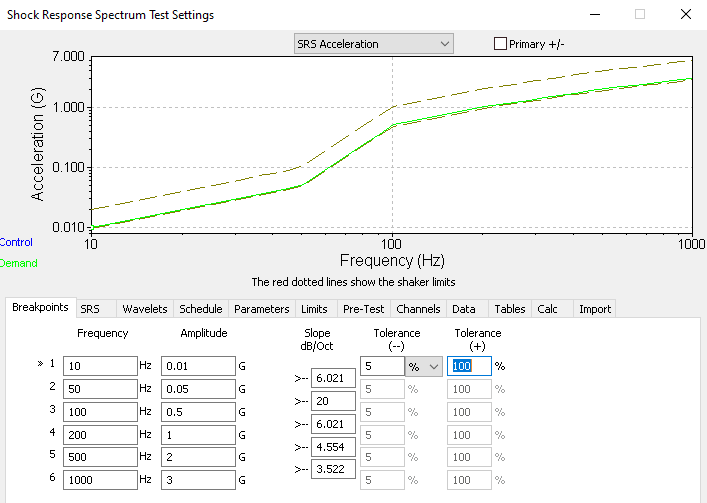
c. Set the Tolerance (-) to 5% and Tolerance (+) to 100%.
d. Select the Synthesize button; the SRS tab will appear.
e. Enter the following parameters:
- SRS Analysis
- Damping: 5%
- Q: 10
- SRS Analysis Frequencies: 1/N Octave intervals
- SRS Analysis Frequency Range: 10 Hz to 2000 Hz
- SRS Frequency Resolution: 1/6 Octave
- SRS Synthesis
- Synthesis Type: Burst Random
- Pulse Duration: 1000 mS
- Auto Sample Rate: 20000 Hz
- Synthesis Frequency Range
- Deselect Automatic
- Start Freq: 10 Hz
- End Freq: 2000 Hz
f. Select the Synthesize button; an SRS graph will appear.
g. To make the graph fit within the limit lines, select the Iterate more button; to make finer corrections, select the Wavelets button and adjust the wavelet values to adjust the line.
h. Select Schedule and adjust the number of pulses to 300 pulses ≅ 5min test when pulse interval equals 1.
i. Select Limits and enter the following limits:
- Startup Drive Limits:
- Max output: 5 V
- Max System Gain: 5 V
- Running Drive Limits:
- Max output: 6 V
- Max System Gain: 6 V
j. Select Parameters and enter the following parameters:
- Feedback Control
- Feedback gain: 3
- Minimum Frequency: 5 Hz
- Maximum Frequency: 2200 Hz
- Sample Rate (1ox the upper frequency)
- Set to at least 20 kHz
k. Select OK and save the test as SRS University Lab Manual Trial.
3. Create the Graphs
a. Select New Graph.
b. Graph 1 configuration
- Graph Type: Acceleration Waveform
- Graph Traces:
- Control Loop Traces: Demand, Control
- Input Channels: Ch1
c. Graph 2 configuration
- Graph Type: SRS Acceleration
- Graph Traces:
- Control Loop Traces: Demand, Control, Tolerance
- Input Channels: Ch1
- Point to Axis Limits and change the x-axis and y-axis to Log
d. Select OK.
4. Run the Test
a. Allow the test to run for at least 10 minutes.
5. Create a Report
a. Select Report
b. In the report, include the following information:
- Customer information: Name and Module Number
- VibrationVIEW Screen
- Breakpoint Table
- Channel Measurements
6. Change the Synthesis Type
a. When the test is complete, select Edit Test > SRS and change the Synthesis Type to Damped Sine Wave.
b. Run the test and create a report.
c. Repeat this process with the following synthesis types:
- WavSyn (Centered)
- Linear Chirp
- Exponential Chirp
7. Evaluate the Test
a. The sounds of the tests are all different, regardless of how you perceive them.
- Damped Sine Wave: a single guitar string being plucked
- WavSyn (Centered): a tick of a clock
- Linear Chirp: a “wheer” or siren sound
- Exponential Chirp: a high-pitched siren
It is important to note that an infinite number of acceleration waveforms (and test sounds) can be generated from the same SRS test specifications. The SRS graphs appear the same but the waveforms that compose the plots are radically different.
SRS is a response to the shock response at each frequency. Many different acceleration waveforms could produce a particular shock at a particular frequency. Thus, one SRS plot can be produced from many different acceleration waveforms.
b. Record the observations seen and heard for the different synthesis types. This can vary depending on the user and the amount of iteration used in the test.