Module 4.1 – Multi-Mode Testing Sine on Random
March 29, 2018
Background
Using VibrationVIEW
Laboratory Exercises
Reference
Back to: VibrationVIEW Syllabus
Module 4.1 is built according to the MIL-STD-810 specification to simulate helicopter vibration exposure for U.S. Army Ch-47M Chinook Helicopter. The test settings depend on the type of helicopter and the location of the material being tested. Essentially, a broadband random spectrum is generated and then sine tones replicate the rotor blade vibrations and harmonic frequencies. These values vary by the type of helicopter, the rotational speed of the main rotor and tail rotor, and the number of blades on the main rotor and tail rotor. In this case, the helicopter has two main rotors.
Procedure
Use the Hardware, Inputs, and System Limits configuration from Module 1.1.
1. Create an Advanced Sine on Random Test
a. Select New Test > Sine on Random.
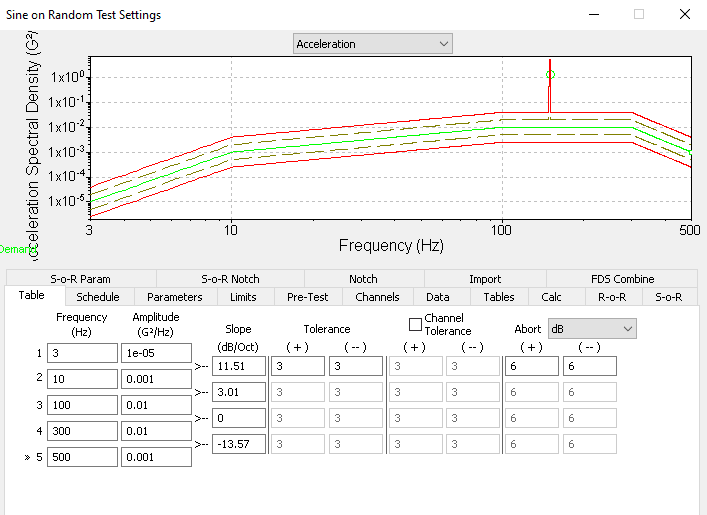
b. Select Table and create a breakpoint table as displayed in the image below:
c. Select Schedule and set the Run for time to 10 minutes.
d. Select Parameters and enter the following parameters:
- General Parameters
- Sample Rate: 16384.0
- Lines: 6500
The test specification calls for a frequency resolution equal to 1 Hz; with these parameters, the frequency resolution will change to 1 Hz.
e. Select Limits and enter the following limits:
- Spectrum Limits:
- Plus Abort (+): 15 dB
- Minus Abort (-): 15 dB
- Plus Tol (+): 9 dB
- Minus Tol (-): 9 dB
- Startup Drive Limits:
- Max System Gain: 1 V/G
- Running Drive Limits:
- Max System Gain: 1 V/G
- Max Output: 3 VRMS
f. Select S-o-R.
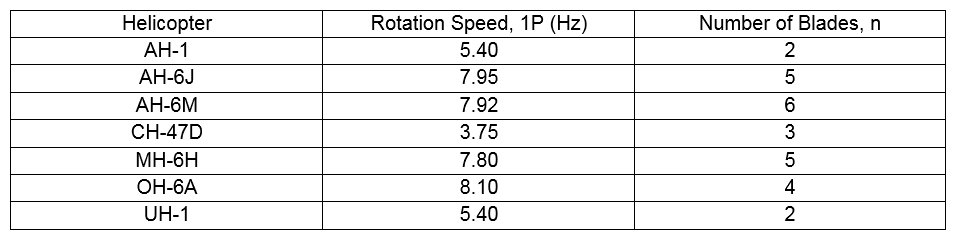
g. Using the following information, calculate the four sine tones for the Ch-47D and enter the calculated frequencies.
- f1 = 1P
- f2 = n * 1P
- f3 = 2 * n * 1P
- f4 = 3 * n * 1P
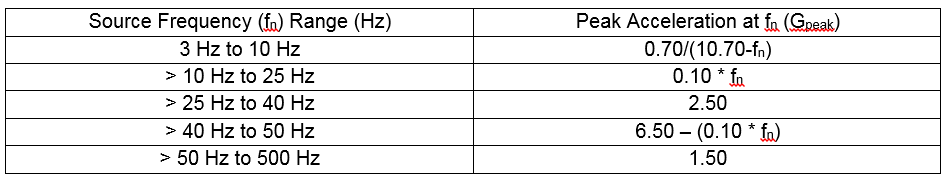
h. Using the following information, calculate the G peak for each frequency and enter the calculated G peaks.
i. Select OK and save the test as Name_MultiMode_SoR.
2. Create the Graphs
a. Select New Graph.
b. Graph 1 configuration
- Graph Type: Acceleration vs. Freq.
- Graph Traces:
- Control Loop Traces: Demand, Control, Tolerance, Abort
c. Graph 2 configuration
- Graph Type: Output Drive Waveform
d. Graph 3 configuration
- Graph Type: Sine Tone Frequency
- Graph Traces:
- Sine Tones: Tone 1, Tone 2, Tone 3, Tone 4
e. Graph 4 configuration
- Graph Type: Sine Tone Amplitude
- Graph Traces:
- Control Loop Traces: Demand, Control
- Sine Tones: Tone 1, Tone 2, Tone 3, Tone 4
3. Run the Test
a. Let the test run for at least 10 minutes.
b. Listen for the effects of the low-frequency sine tones on the broadband random spectrum.
4. Change the Sine Tones
a. Change the sine tones to reflect the properties of a different helicopter and run the test again.
5. Evaluate the Test
a. Note the effects of the low-frequency sine tones on the tone of the broadband random spectrum. It increases the drive output across the frequency board at those specific frequencies for the sine waves.
b. When listening to different helicopter configurations, a helicopter with more blades tends to be louder and produces a sine tone with a higher frequency than those with fewer blades.