Linear vs. Logarithmic Sweep Rates
May 6, 2026
Getting Started
Sine Vibration Testing
Sine Sweep Parameters
Resonance
Sine Resonance Track & Dwell
Running a Sine Test
Back to: Sine Testing
Linear Sweep Rates
When a sweep rate is linear, the controller runs at a constant rate through each frequency in the range. A linear sweep measures frequency width in hertz (Hz). For example: sweep over 1,000 Hz in 1 minute (1,000 Hz/min). The engineer can also specify the time required to complete the entire sweep, and the controller will spend equal time at each frequency within that range.
Logarithmic Sweep Rates
When a sweep rate is logarithmic, the controller runs the same number of cycles at each frequency. With a logarithmic sweep rate, more time is spent at lower frequencies because more cycles occur every second at higher frequencies. As such, the controller runs at an exponential rate.
For a logarithmic rate, frequency width can be measured in decades, or a factor of ten. There is one decade between 10 Hz and 100 Hz, two between 10 Hz and 1,000 Hz, and so on. The frequency width can also be measured in octaves. Two frequencies are one octave apart when one frequency is double the frequency of the other. 10 Hz and 20 Hz are one octave apart, 10 Hz and 40 Hz are two octaves apart, and so on.
Suppose the sweep range or frequency range is 10 Hz to 1,000 Hz. If the sweep rate is set at 2 decades per minute (dec/min), then it would take one minute to complete the sweep, as there are two decades between 10 Hz and 1,000 Hz:
- 10 Hz to 100 Hz
- 100 Hz to 1,000 Hz
Now, suppose the sweep range or frequency range is 10 Hz to 640 Hz. If the sweep rate is set to 2 octaves per minute (oct/min), then it would take three minutes to complete the sweep, as there are six octaves between 10 Hz and 640 Hz:
- 10 Hz to 20 Hz
- 20 Hz to 40 Hz
- 40 Hz to 80 Hz
- 80 Hz to 160 Hz
- 160 Hz to 320 Hz
- 320 Hz to 640 Hz
Comparison
As an example, we ran a test profile twice, once with a logarithmic sweep and again with a linear sweep.
On the frequency vs. time graph, the green trace is the linear sweep frequency, and the blue trace is the logarithmic sweep. The y-axis displays frequency on a linear scale.
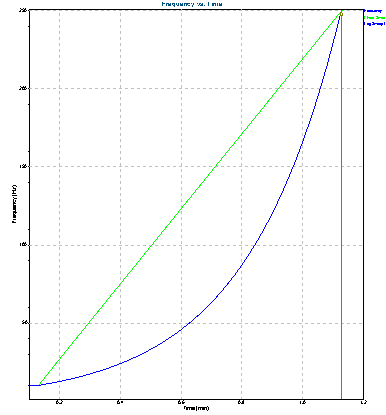
Comparison of linear sweep (green trace) and logarithmic sweep (blue trace). The y-axis displays frequency on a linear scale.
Then, we changed the y-axis to a logarithmic scale. Changing the sweep rate type between linear and log changes the nature of the sweep.
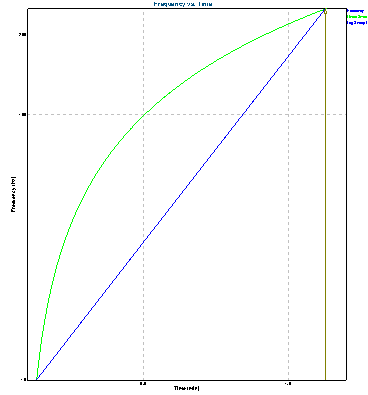
Comparison of linear sweep (green trace) and logarithmic sweep (blue trace). The y-axis displays frequency on a logarithmic scale.
Damage Comparison
A log vs. linear sweep rate will result in different damage to a device under test (DUT) depending on the location of its resonances.
For a theoretical DUT with a resonance at any frequency, the log sweep would result in more damage at low frequencies, and the linear sweep would produce more damage at high frequencies.
The linear sweep rate runs more cycles at higher frequency ranges. If the DUT has high-frequency resonances, more cycles will be applied, resulting in more damage.
We ran several tests in VibrationVIEW’s Demonstration mode to show the theoretical difference in input vibration. We used the fatigue damage spectrum to compute the comparison, which shows the relative difference in damage for a theoretical DUT with resonance at each frequency.
Dividing the log trace by the linear trace creates a damage transmissibility to show the scale of the difference. This example is a visual approximation of the difference in damage between linear and log sine sweep rates if the DUT had a resonance at any frequency.
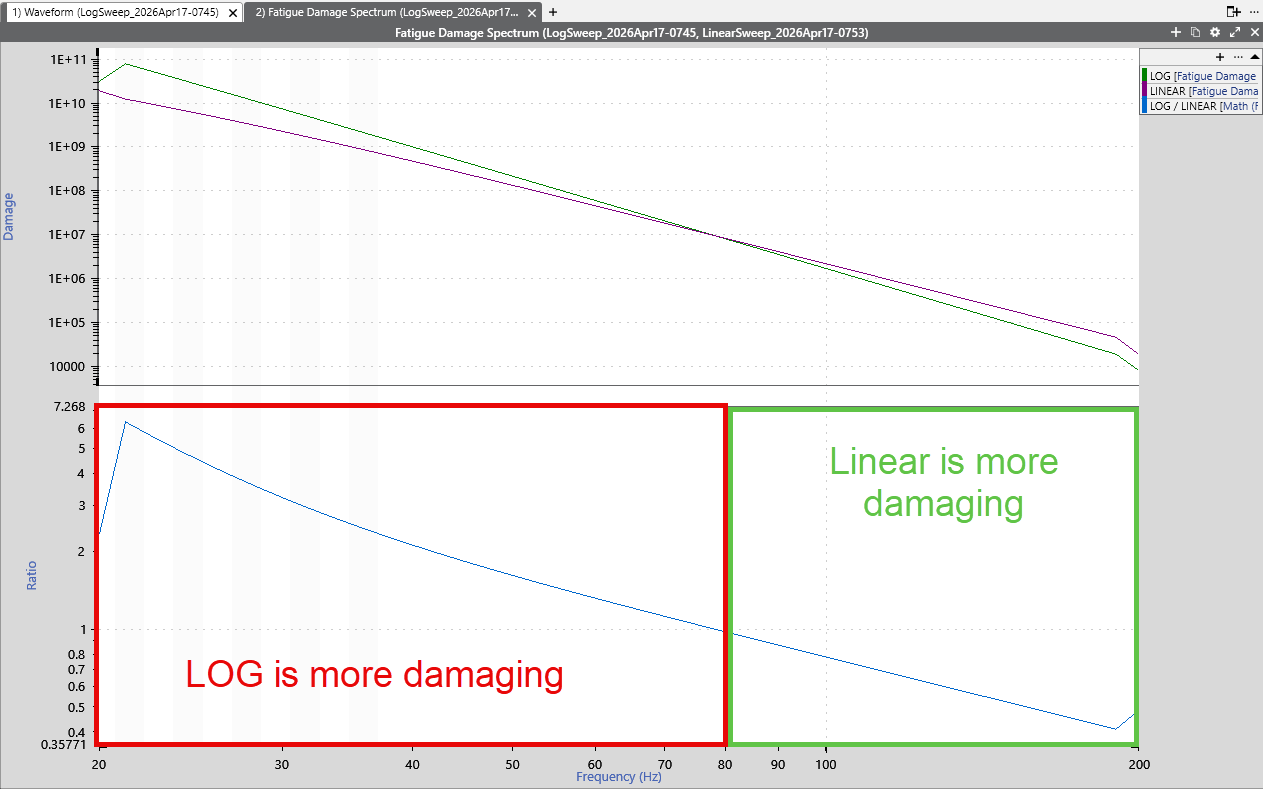
Difference in damage between linear and log sine sweep rates for a theoretical DUT with a resonance at any frequency.