Sine Sweep Test
March 29, 2018
Getting Started
Sine Vibration Testing
Sine Sweep Parameters
Resonance
Sine Resonance Track & Dwell
Running a Sine Test
Back to: Sine Testing
Engineers use a sine sweep test to find a product’s resonant frequencies. Resonance occurs when a product is exposed to an external vibration that matches its natural frequency. Resonance can lead to damage because it amplifies the product’s natural vibration.
Identifying resonant frequencies is essential to product development and qualification. A resonance test such as a sine sweep helps identify and observe a product’s response to a resonant frequency.
Engineers use resonance testing for:
- Reproducing field failures at resonant frequencies
- Pass/fail criteria: determining if resonances are found in critical frequency ranges during production or pre-production
A sine sweep test can be employed with the VibrationVIEW Sine software module (free demo).
Sine Sweep Process
A frequency sweep allows the engineer to quickly observe a product’s response in the frequency range of the operational environment. During a sine sweep test, a vibration shaker pans, or “sweeps,” through a range of frequencies. The motion of the shaker is sinusoidal; however, the frequency of the vibration increases or decreases throughout the test.
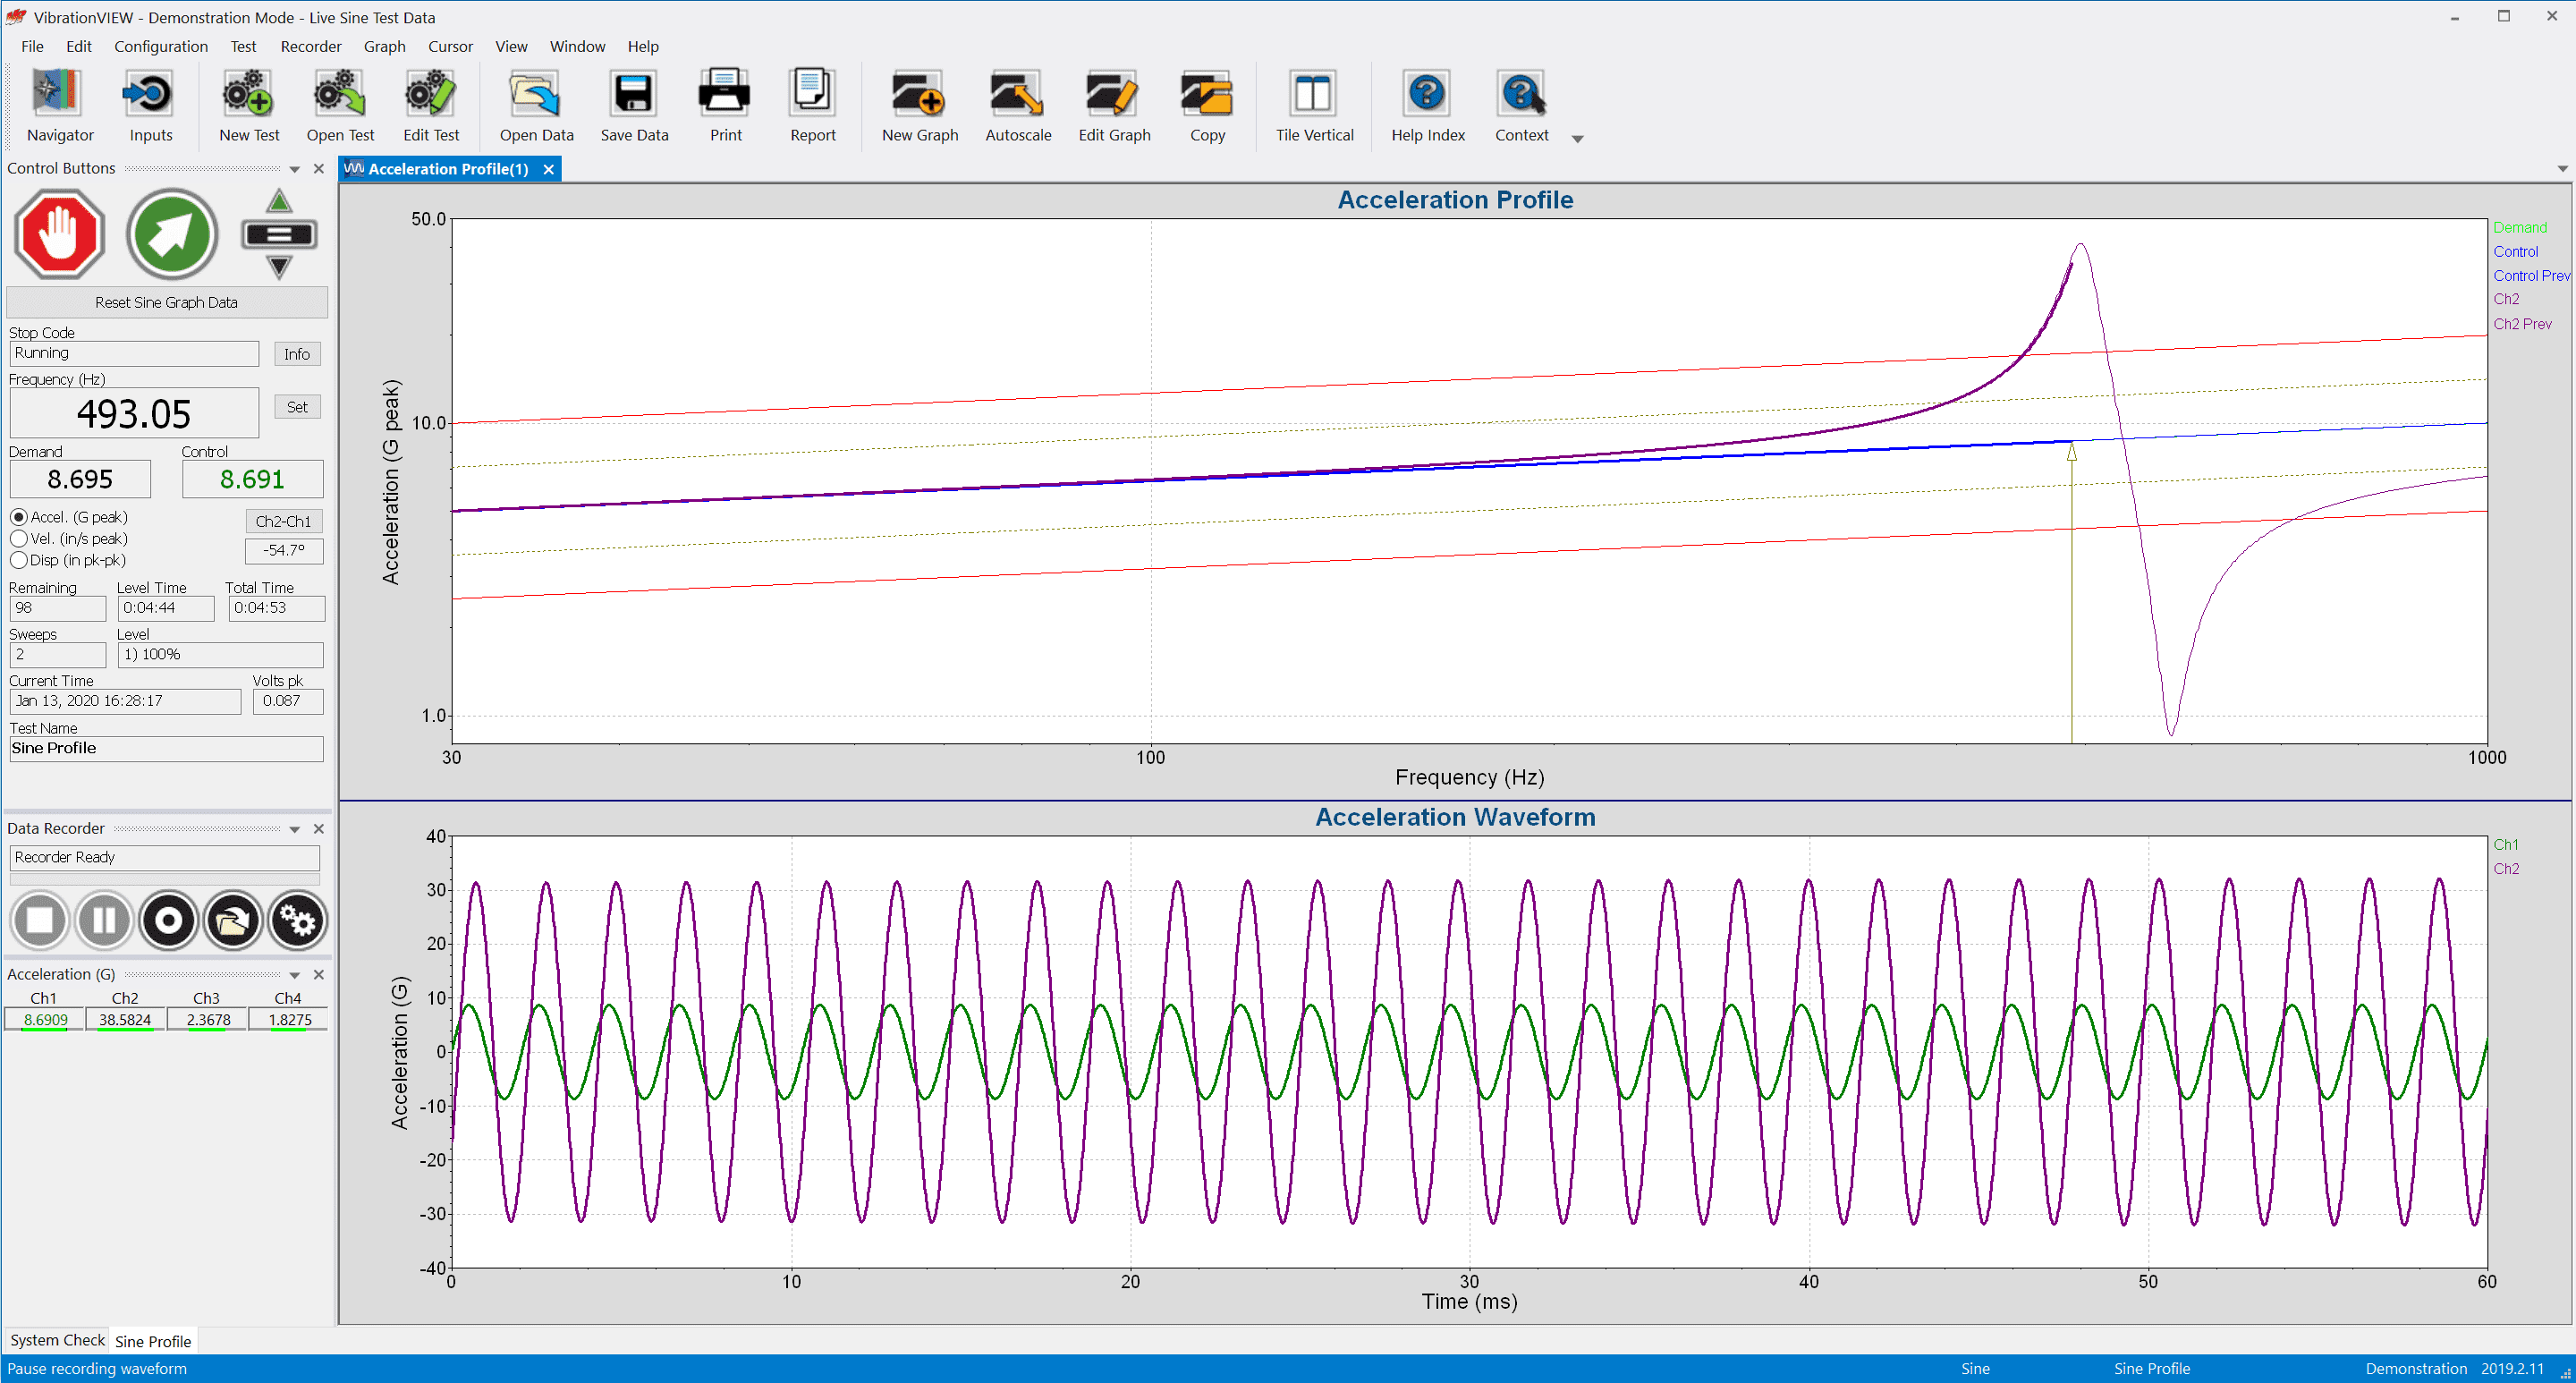
A sine sweep test in the VibrationVIEW software.
One sweep equals a single pass from a minimum to maximum frequency, max to min, or min to max to min (depending on the software). The engineer sets the parameters for a sine sweep test, which we will discuss in the following lessons.
Upon completion, the test will have run over a range of frequencies. After, the engineer can analyze the results and identify peak transmissibility: the ratio of input to output acceleration.
Run an example simple sine test in Module 1.1 of the VibrationVIEW Syllabus.
Necessary Hardware
At the beginning of a sine sweep, the shaker may only be vibrating at a rate of ten cycles per second (10Hz). However, it may be vibrating at 5,000 cycles per second (5,000Hz) at the end of the test.
An accelerometer is a device that measures acceleration and is placed on the shaker head and device under test (DUT). It sends the acceleration values of the shaker head and DUT to the vibration controller.
During the test, the controller monitors the acceleration of the shaker head and ensures the correct levels are applied to the DUT. The controller also monitors the DUT’s acceleration and displays the values on a graph for the test engineer.
Example of a Sine Sweep Test
Figure 2.4 displays a shaker set up with a metal beam that represents a product. A control accelerometer is attached to the mounting point and connected to Channel 1 on the controller.
A second accelerometer is attached to the end of the beam and connected to Channel 2 on the controller. The second accelerometer will record the accelerations at this location. In this case, we are interested in the resonances of the long arm of the beam.
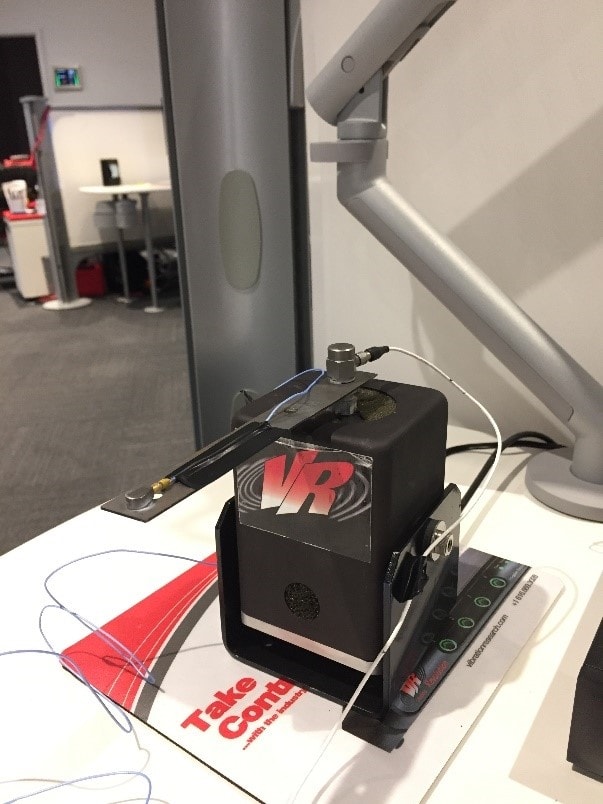
Figure 2.4. An example shaker setup with a metal beam.
Running the Test
We ran a 1G sine test over a frequency range of 10 hertz (Hz) to 1,000Hz. We wanted the controller to output a sine signal to the shaker so that the control accelerometer (Ch1) would experience 1G acceleration at the peaks of each cycle. During the test, the controller monitored the acceleration at the end of the beam.
As the controller swept up the frequency range, it displayed the control acceleration and the acceleration at the end of the beam. Ideally, the control acceleration would be 1G for the test’s duration.
Figure 2.5a displays the acceleration over the frequency range. The green trace is the control, and the blue trace is the acceleration of Ch2. Figure 2.5b displays the readings in an acceleration versus frequency graph.
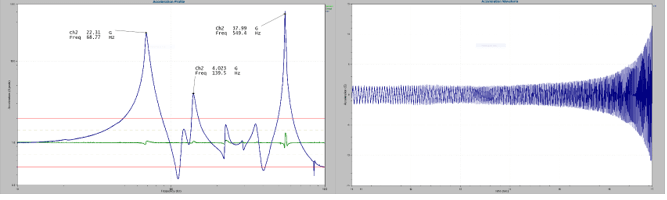
Figure 2.5a. The acceleration over the frequency range. Figure 2.5b. An acceleration versus frequency graph.
Interpreting the Graphs
Figure 2.5a displays the acceleration over the frequency range. The control accelerometer mostly experienced 1G during the test, although there was a deviation near the resonances.
The resonances of Ch2 are evident in the graph. For example, at 68.77Hz, the control vibrated at approximately 1G. The end of the beam vibrated at 22.31G. At 549.4Hz, the shaker shook at a level lower than 2G, and the end of the beam shook at 37.99G.
Figure 2.5b displays a sample of the acceleration Ch2 experienced near the resonance. Two things are evident from the graph. First, the vibration’s frequency increases over time, and the cycles are spaced closer together as time increases. In other words, more cycles occur per second later in the test. Second, the amplitude of the acceleration of Ch2 increases dramatically near the resonance, which the engineer could see and hear.
The peaks in the acceleration over the frequency graph (Figure 2.5a) indicate the resonances of the metal beam. These are the frequencies where the beam vibrated at a high level in response to a vibration near or at its natural vibrating frequency.
Now, suppose the metal beam was a car mirror, and the resonances were excited anytime the car was on a highway. The resulting vibration would reduce visibility and could be a potential hazard.
It is important to test for resonances, as demonstrated in this lab example and many real-world applications. In the subsequent lessons, we will discuss the parameters of a sine sweep test and introduce another resonance test method: sine resonance track and dwell (SRTD).