Traces & Cursors
November 7, 2024
Getting Started
Analysis Options
Recording & Analyzing Live Data
Back to: Getting Started with ObserVIEW
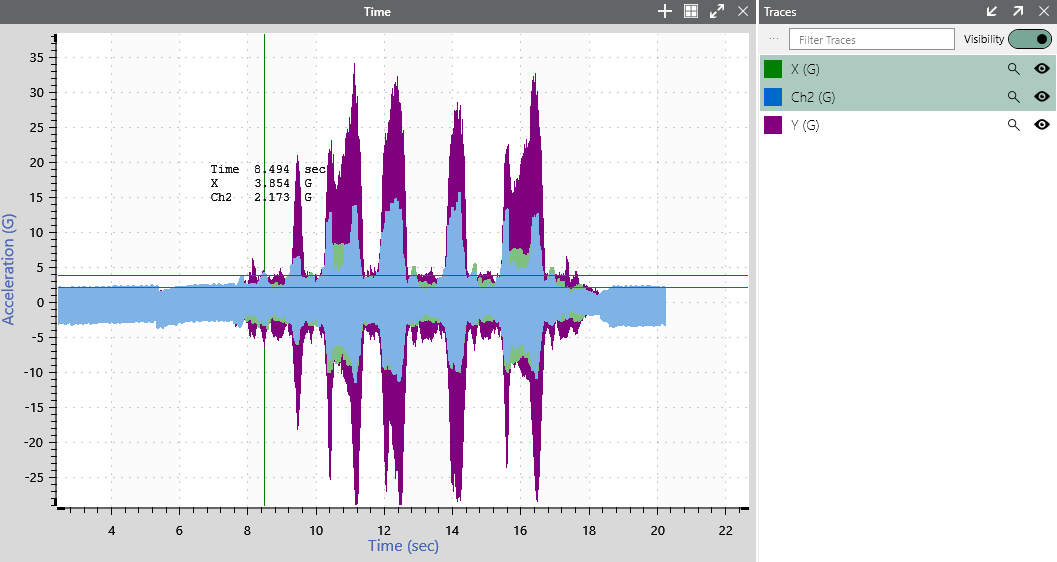
In ObserVIEW, data are presented as line “traces” on the main graph.
The trace properties pane is to the right of the main graph (by default). The Properties pane includes options for viewing/editing the traces that depend on the graph type. For time waveforms, properties include sample rate, number of samples, and min and max time.
Cursors
ObserVIEW’s cursor feature improves the user’s ability to parse through data. Cursors appear as vertical lines in the graph window and include an annotation with the data values for the cursor’s location/range. Engineers can apply cursors to calculate and display additional information not included in the graph.
- Annotate resonances
- Identify maximax
- Find frequency (delta cursor)
- Identify data with orders (harmonic cursor)
- And much more

Copy and Paste Function
The copy and paste command in ObserVIEW allows the user to move data between graphs and software applications.
- CTRL + C: Copy
- CTRL + V: Paste
- Right-click on a graph > Copy Graph
- Paste Graph as an image to Word
- Paste Graph as data to Excel
- Right-click on a trace > Copy Trace
- Paste Trace as data to Excel
- Paste Trace as data to a graph
Math Channels and Traces
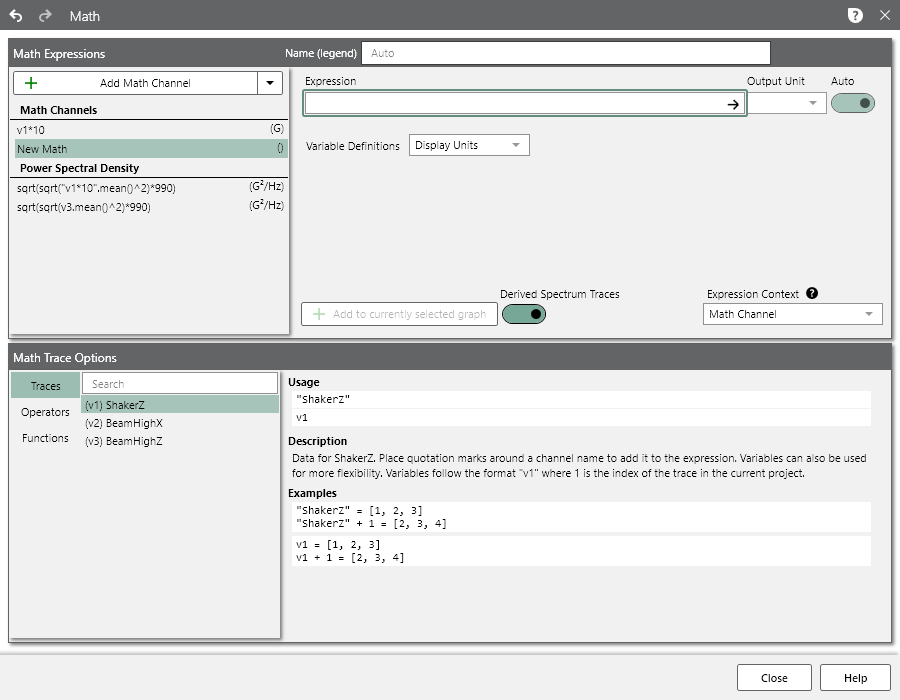
The Math feature plots a user-defined math equation on a time or frequency-domain graph. It allows the user to implement custom math operations not defined by the current graph types. To open the Math dialog, right-click any non-spectrogram graph and select Add Math Channel/Trace. To learn more, visit the 40 Uses for Math Traces resource.

ObserVIEW Math dialog.
