Analyze Data
March 31, 2021
Getting Started
Analysis Options
Recording & Analyzing Live Data
Back to: Getting Started with ObserVIEW
ObserVIEW’s feature list is largely dedicated to analyzing time-waveform data. Vibration data are recorded over time, but it is often advantageous to transform it for a different perspective. Patterns such as resonant frequencies that are not as apparent in the time domain become readily apparent in others, such as frequency.
Fast Fourier Transform
The frequency domain is a standard domain for analysis in vibration test engineering. ObserVIEW uses the fast Fourier transform (FFT) to project continuous time data into the frequency domain.
For a complex signal, the FFT helps to determine excitation frequencies and the amplitude at each frequency. Additionally, it highlights changes in frequency and amplitude and the harmonic excitation in a frequency range.
To add a new FFT graph in ObserVIEW, select the Add Graph dropdown button in the main ribbon and select the FFT option.
To add an FFT trace to an existing frequency graph, select anywhere in the graph and navigate to the Traces pane to the right of the main graph. Select Add/Remove Traces. Navigate to the FFT dropdown list and select the traces to graph as an FFT.
The summary graph below the main graph indicates the range of data analyzed to generate the FFT.
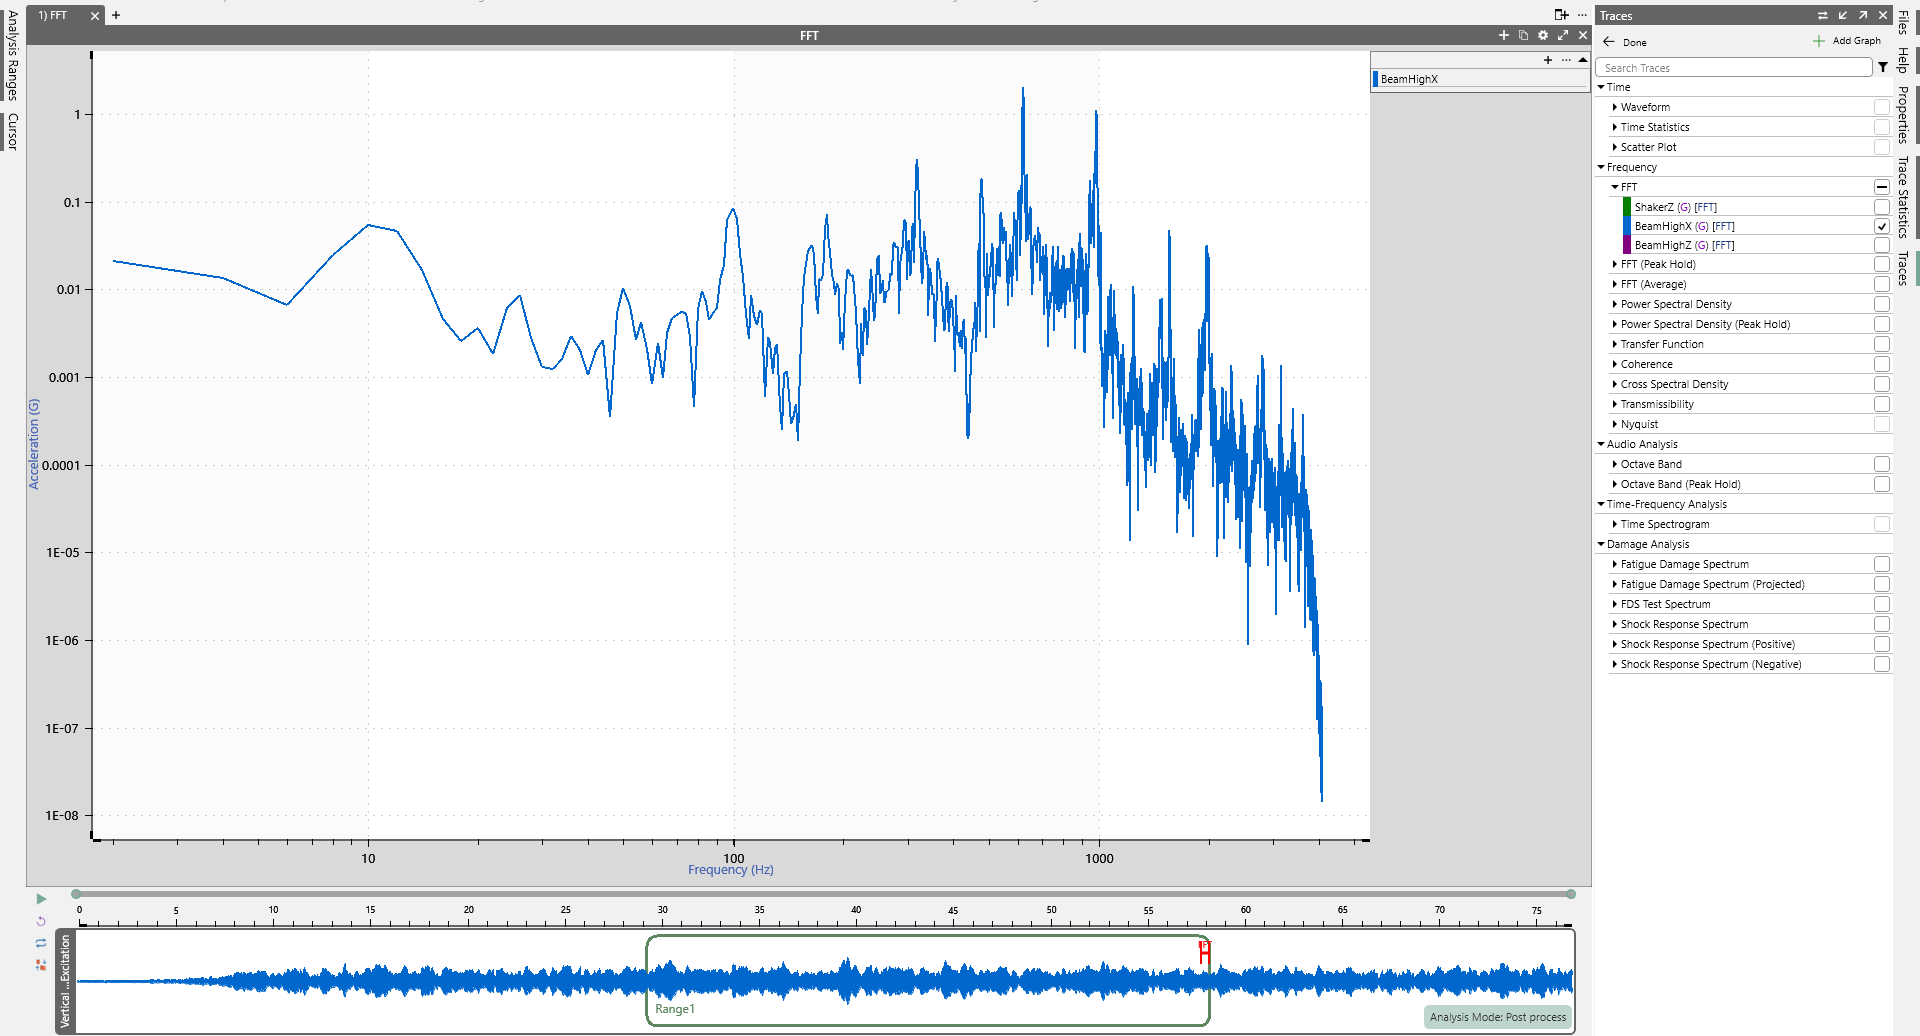
An FFT graph in ObserVIEW.
The FFT properties include analysis lines, window function, and data bias range. The FFT assumes data to be continuous, and a window function is applied to minimize aliasing.
Power Spectral Density
The power spectral density (PSD) is another powerful analysis tool for understanding and characterizing random vibration. It estimates the distribution of a signal’s strength across a frequency spectrum. Vibration test engineers can leverage the PSD in various ways to gain insight into the dynamic behavior of the test data. Use examples include:
- Estimating stress levels and assessing fatigue life of critical components
- Comparing a test run to a test standard or multiple test runs (for PSDs with the same parameters)
- Troubleshooting problems like component failure and assessing root causes
- Identify contributors to vibration energy and their frequency ranges
Analyze Data
ObserVIEW includes several options for analyzing data in the frequency domain in addition to the FFT and PSD.
Analyzer Traces
Analyze time waveform data in the frequency domain.
- Fast Fourier Transform (FFT): transforms time-domain data into the frequency domain
- Power Spectral Density (PSD): displays the amount of power in a band of frequencies
- Transfer Function: identifies a resonance or antiresonance in a system
- Coherence: indicates how closely a pair of signals are statistically related
- Cross Spectral Density: displays the amount of power in the frequency band of a pair of signals that have been multiplied in the frequency domain
- Transmissibility: identifies a resonance or antiresonance in a system
- Spectrogram: displays the amplitude of multiple FFTs
Analysis Options
The analyzer trace settings are located in the Analyzer Trace Settings section of the Home ribbon menu and the Properties pane.
ANALYSIS LINES
Determines the number of samples the software uses when analyzing the waveform. Along with the sample rate, analysis lines determine the frequency resolution of the analyzer.
ANALYSIS FRAMES AND AVERAGING DOF
The analysis frames value is the number of FFT windows the software uses to compute traces based on Welch estimators. The value can be entered manually entered and locked so the number of frames is not affected by zooming in and out on the time waveform graph.
The averaging degrees-of-freedom (DOF) value displays the statistical degrees of freedom associated with the PSD. After entering an averaging DOF value, the software automatically selects the analysis frames value to meet the target averaging DOF. Averaging DOF can also be locked.
WINDOW FUNCTIONS
Windowing provides a weighted selection of a portion of a time waveform for the purpose of FFT analysis. It is accomplished by multiplying the original time waveform by a window function of some selected width. The ObserVIEW Help file includes a comprehensive table of window functions for assistance with selection.