Live Analyzer
March 31, 2021
Getting Started
Analysis Options
Recording & Analyzing Live Data
Back to: Getting Started with ObserVIEW
A Live Analyzer session is the default display in ObserVIEW when:
- The hardware is connected to the workstation PC via Ethernet
- Live Analyzer is enabled
When the hardware is connected to a Live Analyzer session, the user can access all analysis controls while live data are streamed in from the device. They can pause the incoming data to perform a more in-depth analysis and export the waveform, then resume the live feed without losing any of the data that occurred while the stream was paused (so long as the data was paused for less than the user-configurable buffer duration period).
The Live Analyzer license key is included with a valid Upgrades & Support Agreement. The first year of the agreement is included with any hardware purchase.
Live Analyzer is available for use in both ObserVIEW and VR Mobile when they are connected to a Vibration Research I/O unit. VR Mobile is displayed in the side pane of a Live Analyzer session.
Connect to Live Analyzer
Live Analyzer performs best when the I/O unit is connected to the computer via Ethernet. The ObserVR1000’s integrated WiFi has a short range and limited sample rate and is not recommended. An external WiFi adapter offers a better range and functions at a full sample rate.
- Turn on the ObserVR1000 and connect the device to a power source.
- Select Connect to Device > Configure Hardware. Each device will have a status to the right that indicates the state of the device. Alternatively, select New Project > Live Analyzer.
- Choose the device and select Connect. A stream of data will appear from the device’s enabled channels.
Settings
The Live Analyzer settings are located to the left of the live data stream. Click the three-line menu icon to view all settings options. The icons for the most common settings options are located to the right of the three-line menu icon.
- Settings: Adjust settings for the recorder, network, system, etc.
- Inputs: Select/deselect channels, adjust channel settings, turn on transducer power for select channels, and more
- GPS Readings: View GPS readings
- Tachometer: Enable/disable tach input configuration
- Triggering: Enable/disable triggers or add a trigger
- Channel Graph: Adjust waveform and/or FFT graph settings and highlight graph traces
- Channel Readings: View/configure input and tachometer readings
- Files: Adjust/confirm any files on the device
- Info: Adjust/confirm additional settings
- Help: Access the ObserVIEW Help file
Tip: If a settings option is disabled during the live data stream, pause/stop the data stream to enable the option.
Using Live Analyzer
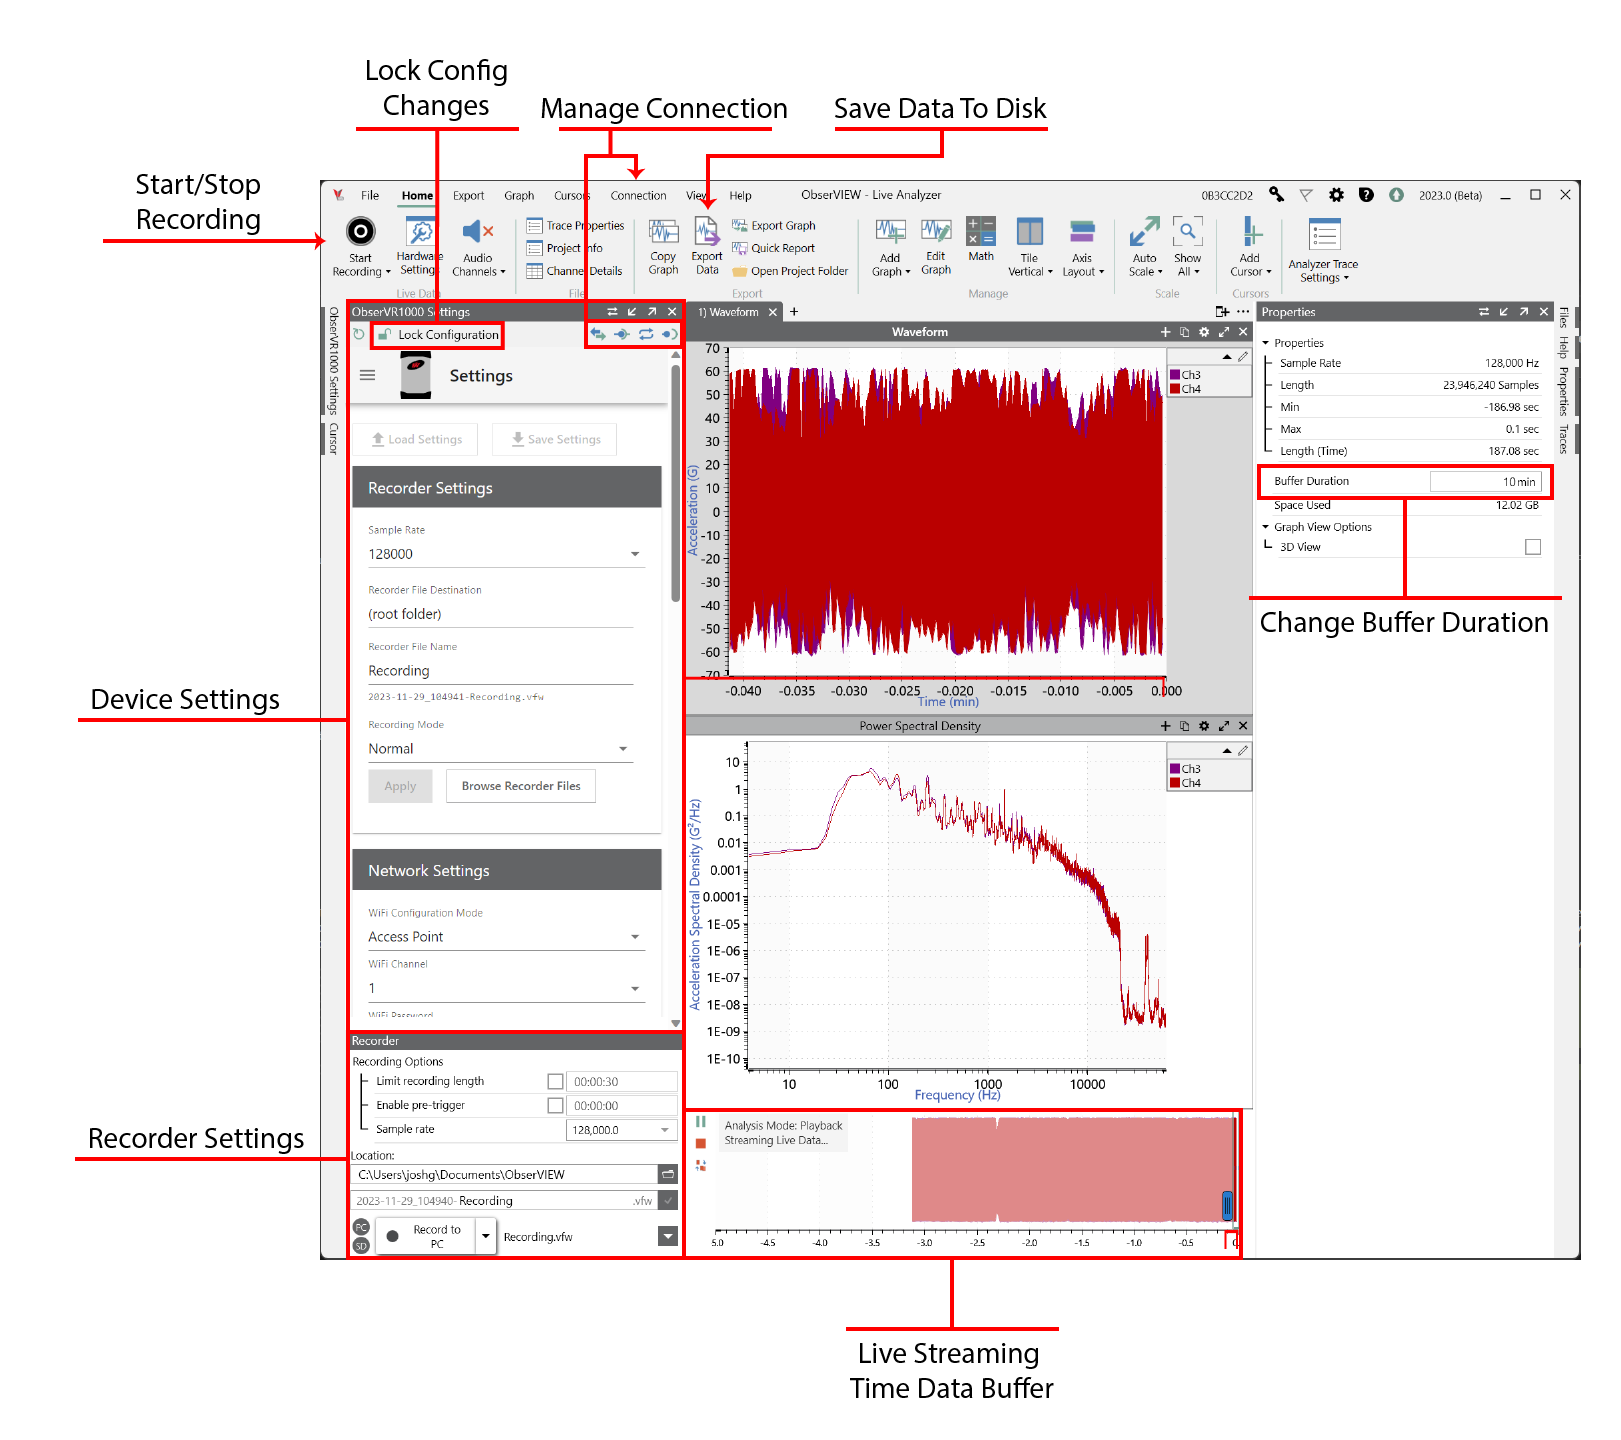
Overview of the Live Analyzer display.
Start, Pause, or Stop the Data Stream
To start, pause, or stop the data stream, select Home and point to the Live Data section in the main ribbon. A start/pause and stop button are also located in the upper left corner of the live data stream. The space bar on a keyboard can also be used to start/pause the live stream.
Pause the live data stream to analyze and export data. To save a recording, select File > Export. ObserVIEW will continue to collect data when the stream is paused. When the stream is stopped, ObserVIEW will stop collecting data and reset any analyzer features.
Graphing Features
Users can access all the graphs under their license type when connected to Live Analyzer. It includes the basic time waveform and fast Fourier transform (FFT) graphs. An Advanced license can be purchased separately.
Connection
Click Connection to switch to VR Mobile or reconnect/disconnect the controller. The connection options can also be located at the top right of the Settings toolbox.
Post-Process Analysis
Export a segment of the summary window to a .vfw file for post-process analysis.