Advanced Licenses
March 31, 2021
Getting Started
Analysis Options
Recording & Analyzing Live Data
Back to: Getting Started with ObserVIEW
In addition to options for analyzing and editing data, ObserVIEW includes several advanced software licenses: Modal, Order Analysis, FDS, and SRS.
Modal Capture
Modal analysis helps identify a structure’s response to excitation. In ObserVIEW, the Modal software collects responses at each point of acquisition (called a degree of freedom), averages the responses at each DOF, and generates a smooth transfer function (frequency response function). From there, the data can be exported to a modal analysis software such as MEscope.
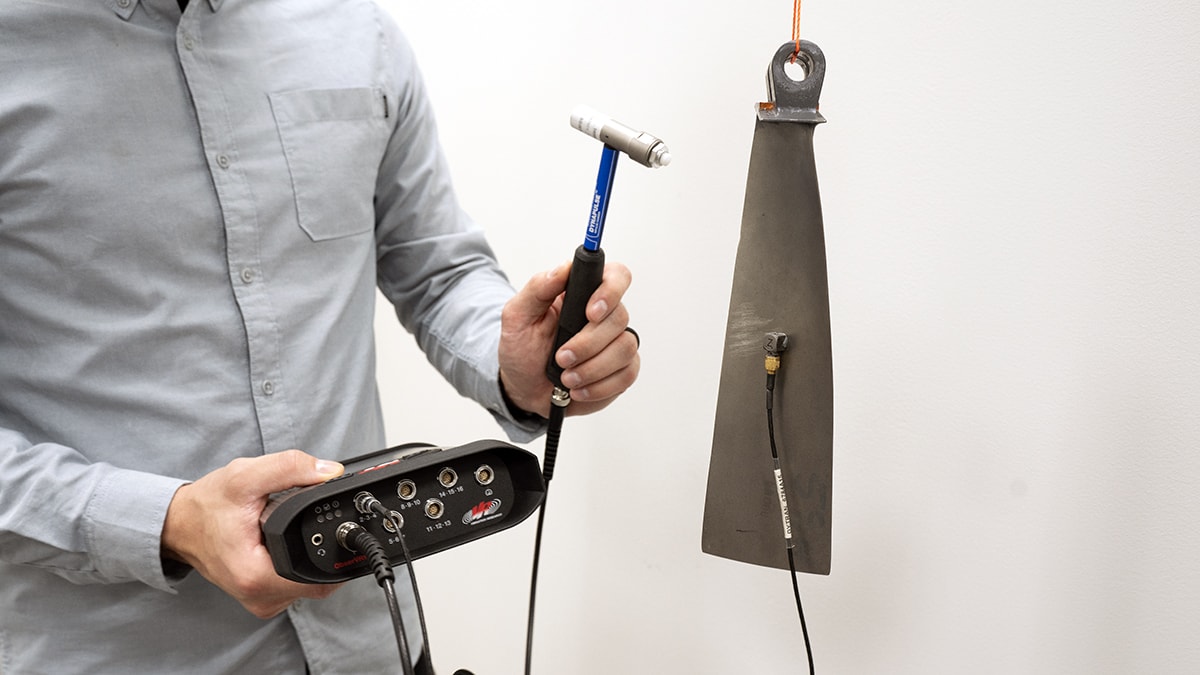
Impact hammer for modal testing with the ObserVR1000.
With the Modal software, the user can perform actions such as:
- Manage table of hits per location and review hits
- Average multiple data recordings
- Calculate decay rate from transient ring-down events
- Manage the recording channel using a large, interactive display
Order Analysis
Order Analysis includes a set of tools to analyze field data with dominant rotational or sinusoidal components. It extracts orders from recordings with a defined tachometer (angular velocity) channel. Then, it selects the orders with the highest peak acceleration levels within the analysis range.
From there, the user can run Sine Tracking, Analysis and Generation (STAG) to generate a sine-on-random test profile for use in VibrationVIEW.
STAG is software that is exclusive Vibration Research. Combined with ObserVIEW’s FDS capabilities, STAG allows for the analysis, acceleration, and generation of vibration tests reflective of the real world.
With STAG, the user can perform actions such as:
- Effectively analyze field data with dominant sinusoidal vibration
- Quantify noise and vibration in machinery with rotating components
- Develop tests and analyze data with software tailored for equipment with rotational components
FDS
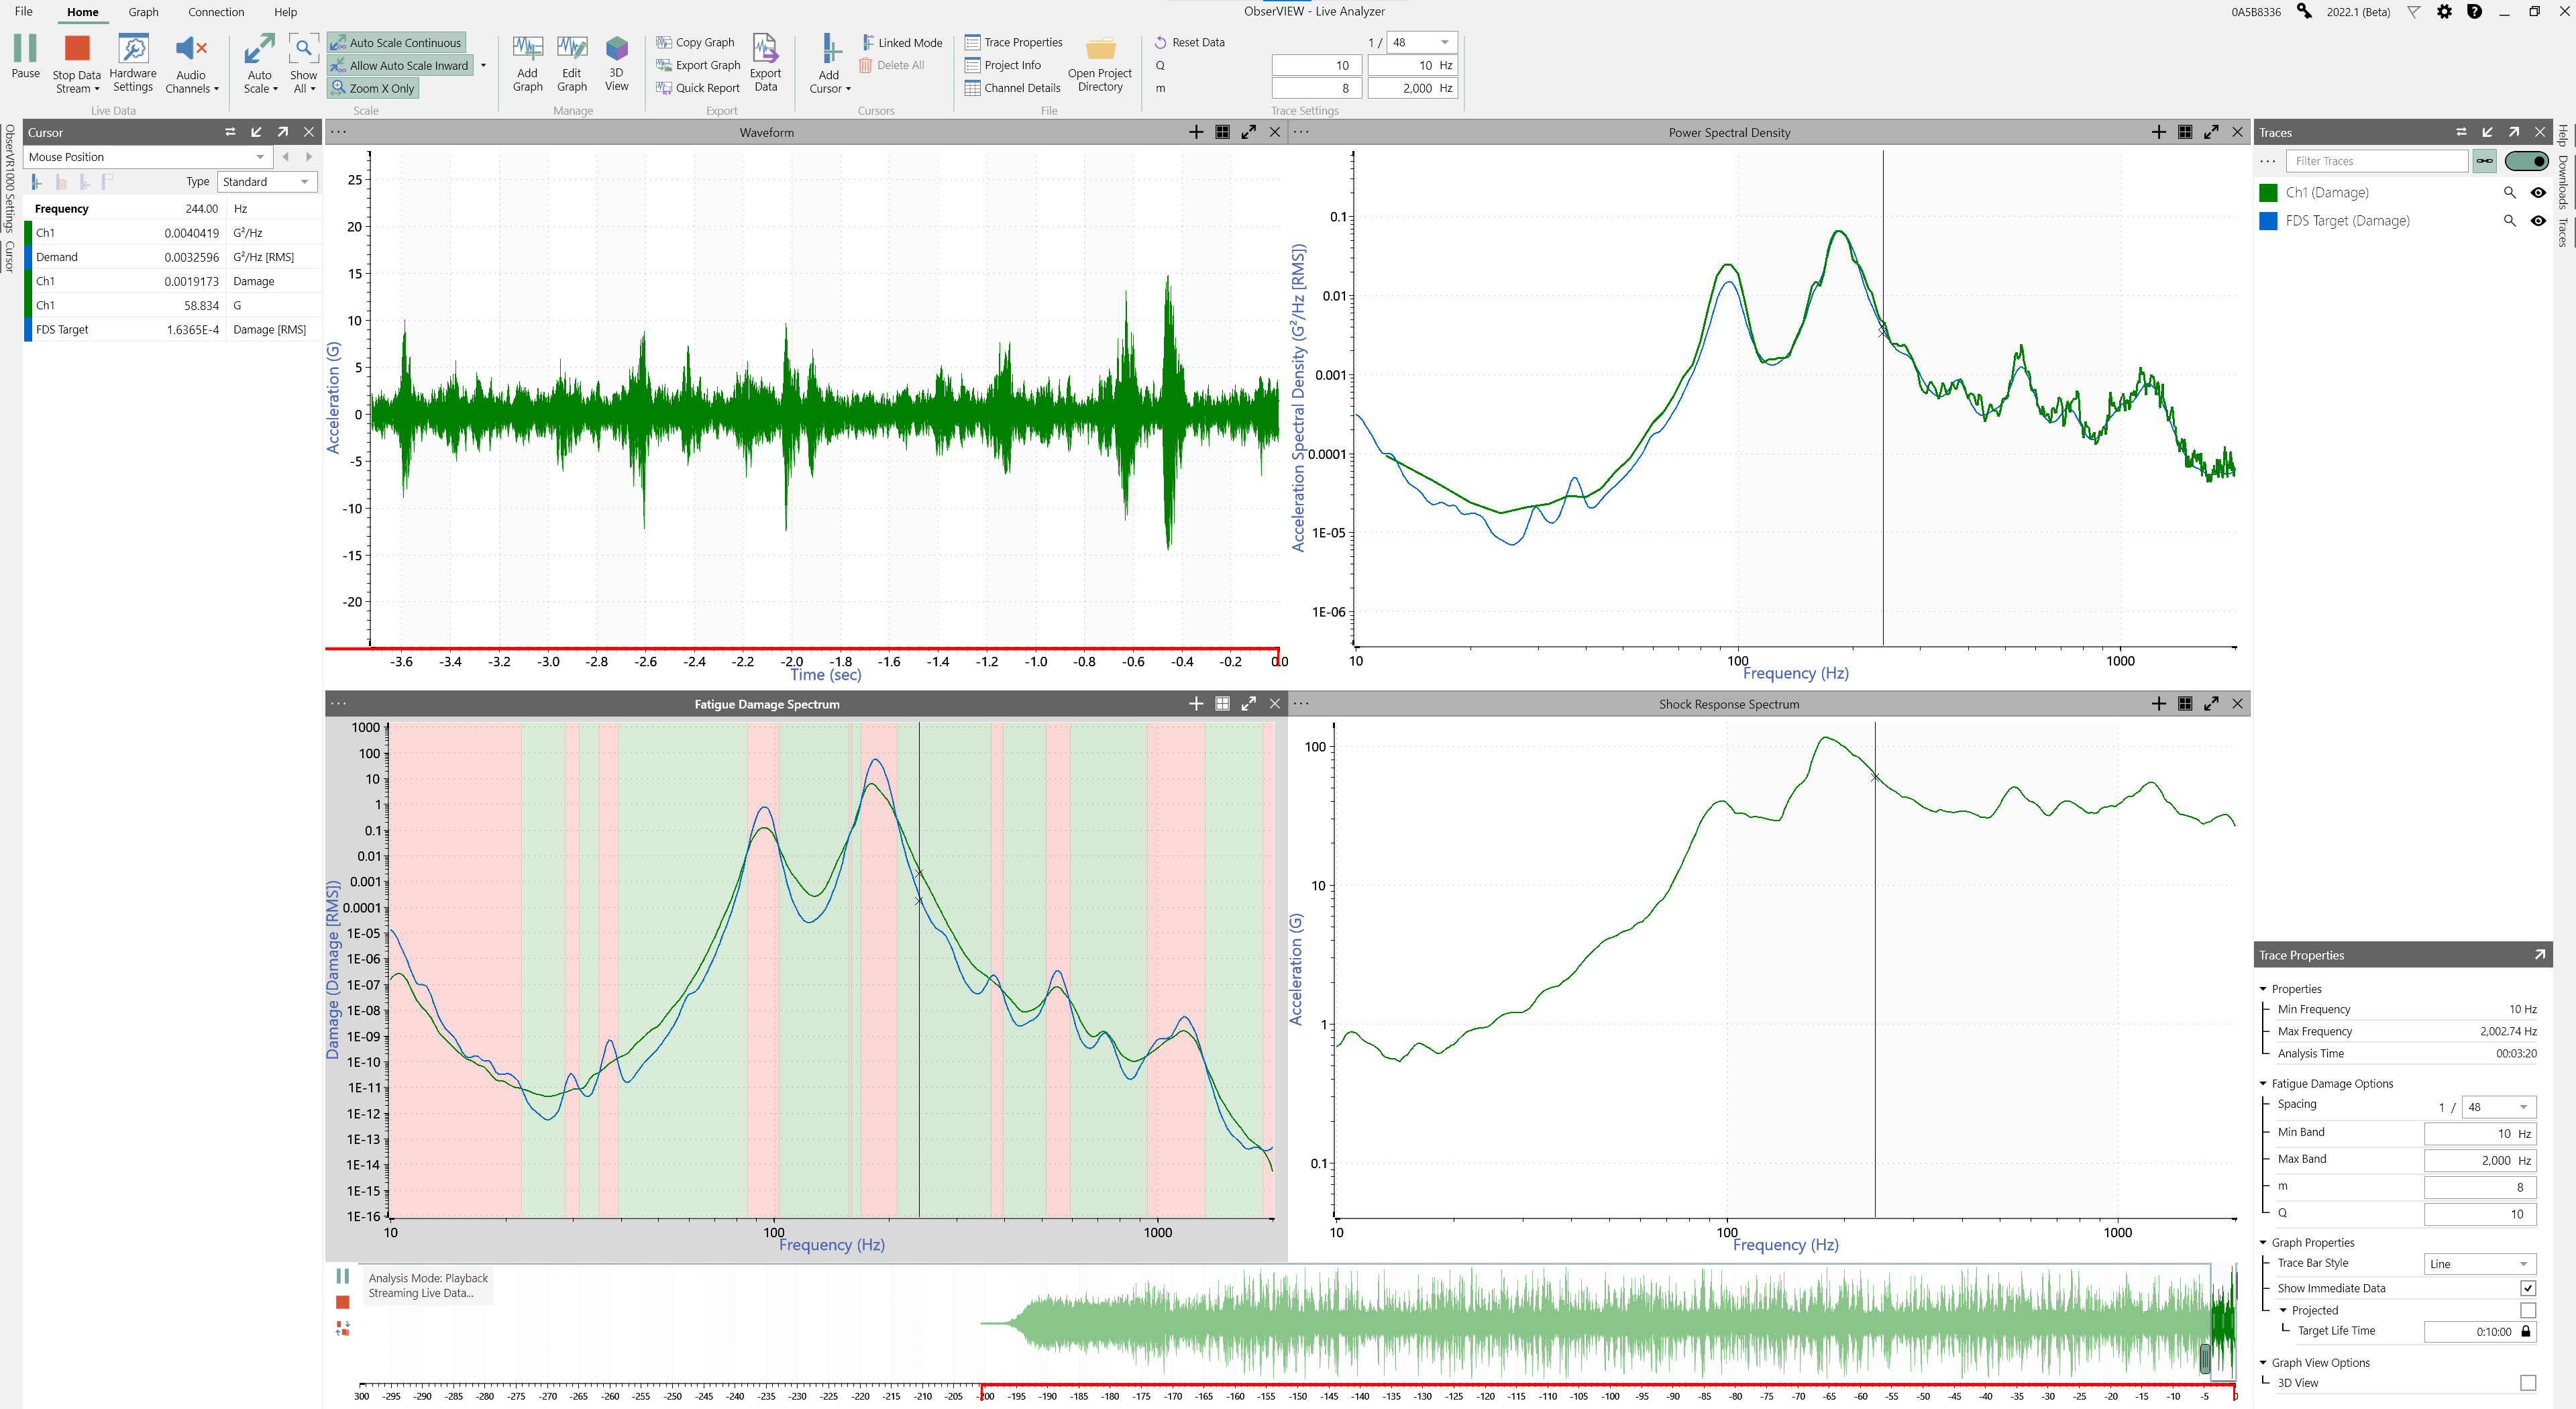
In Live Analyzer or post-process, the user can apply the fatigue damage spectrum (FDS) to assess a product’s relative fatigue damage and perform a real-time measurement to indicate when a test achieves desired levels.
Test Profile Development
Use the FDS to create a random test profile that is the damage equivalent to the recorded environment. ObserVIEW converts the FDS into a power spectral density (PSD) using Henderson-Piersol’s fatigue calculation method. The result is a single PSD profile for a recorded time-history file.
Accelerate the random test with user-defined m, Q, target lifetime, test duration, and kurtosis control (optional).
Real-time Fatigue Measurement
Live FDS helps identify when fatigue levels of a test profile are achieved compared to a field recording. Review the live stream of a random test to determine when the test levels meet recorded data or a test standard. Perform the analysis live or post-process and identify how long it takes to reach real-life fatigue levels.
SRS
Generate a shock response spectrum (SRS) to analyze environments with complex transient shocks. Similar to the FFT, the SRS represents time data in the frequency domain. The filters that the SRS applies to the time-data plot show the magnitude of the peak response for each filter over the data’s frequency range.
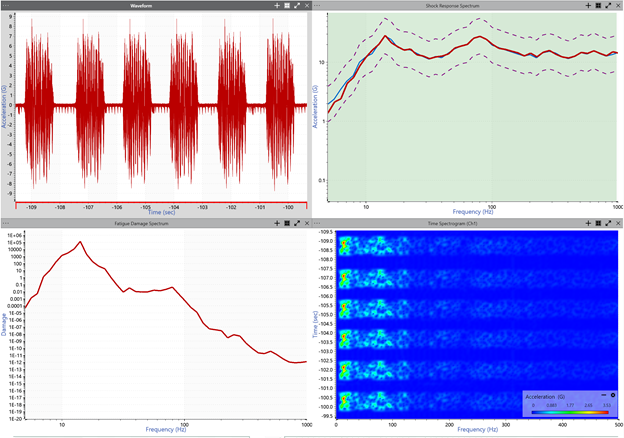
Users can generate an equivalent SRS test in VibrationVIEW by copying the SRS graph in ObserVIEW and pasting it to the test profile breakpoint.
To learn more about the additional software options in ObserVIEW, please visit the software page.