Generating an SoR Test Using Recorded Data (STAG)
February 23, 2021
Analyzing Waveforms
Reproducing Waveforms
Fatigue Damage Spectrum (FDS)
Sine-on-Random (SoR) Test Generation
Shock Response Spectrum (SRS)
Back to: Test Development with Recorded Data
Sine-on-random mixed-mode tests contain sine tones superimposed on random background vibration. SoR tests accurately replicate the vibration environments of components that generate dominant sinusoidal vibration, such as rotating components.
Sine Tracking, Analysis and Generation (STAG)
ObserVIEW‘s Sine Tracking, Analysis and Generation (STAG) tool uses recorded time-history data from a run-up or coast-down to generate an SoR test profile. STAG uses order analysis and sine-tone profile creation to isolate, extract, and create an accelerated sine profile or series of sine profiles from a recording. It employs the fatigue damage spectrum (FDS) to analyze the remaining random vibration. Together, the sinusoidal and random test profiles form an accelerated SoR test that is the damage equivalent of the recorded environment.
As discussed in the previous lesson, STAG processes the sinusoidal test profiles separately because the FDS assumes all vibration is random. The STAG tool ensures the SoR test profile accurately represents the sinusoidal vibration found in the original environment.
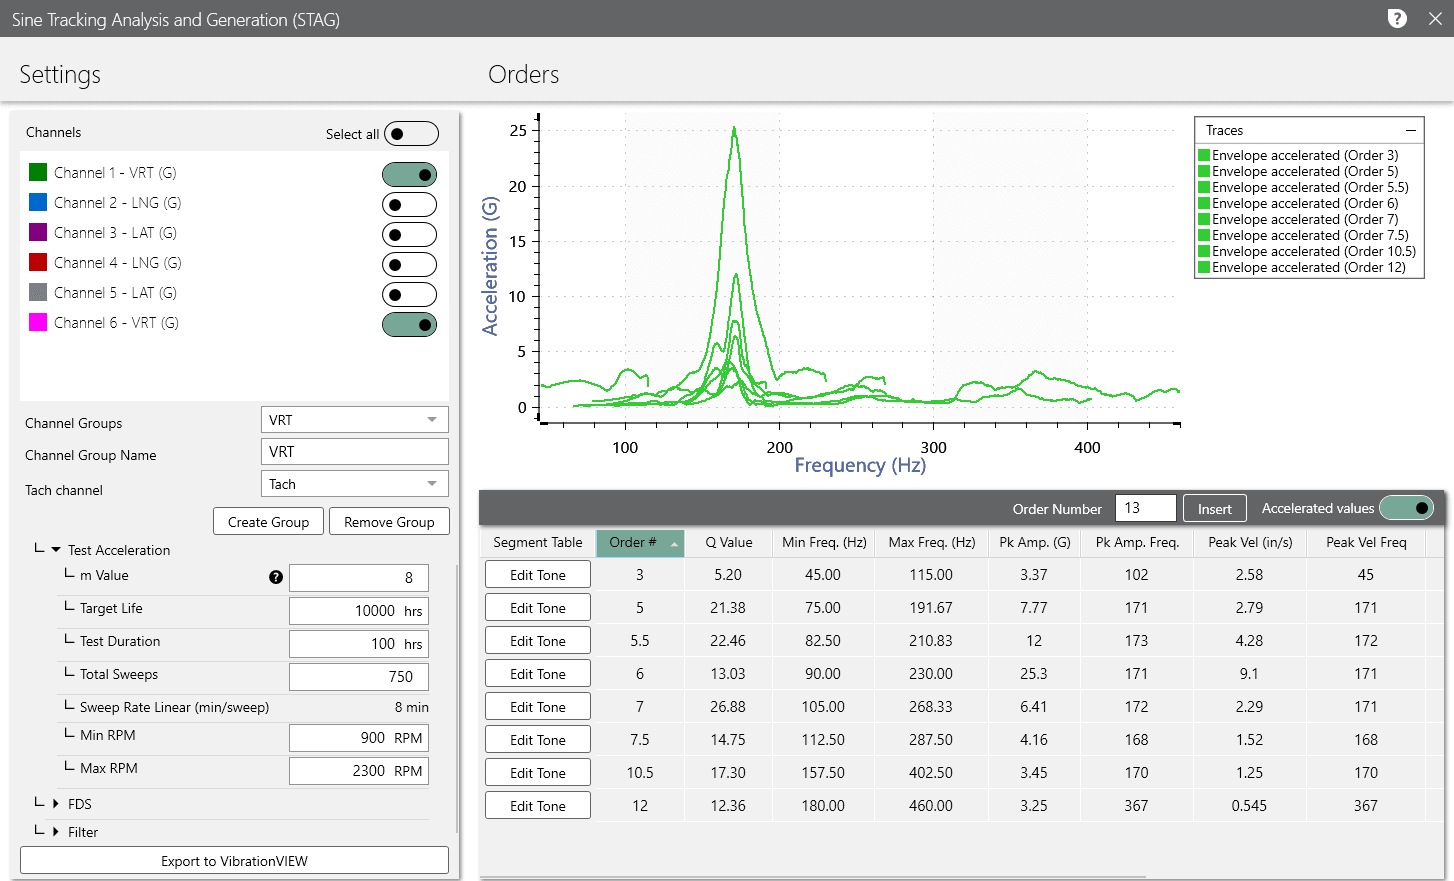
Sinusoidal Test Profiles
STAG first processes the sinusoidal vibration from the rotating component(s). It analyzes the order content of the recorded time history and identifies the vibration generated from the rotational source. As such, it requires a reference RPM trace relating to the rotational component’s measured vibration.
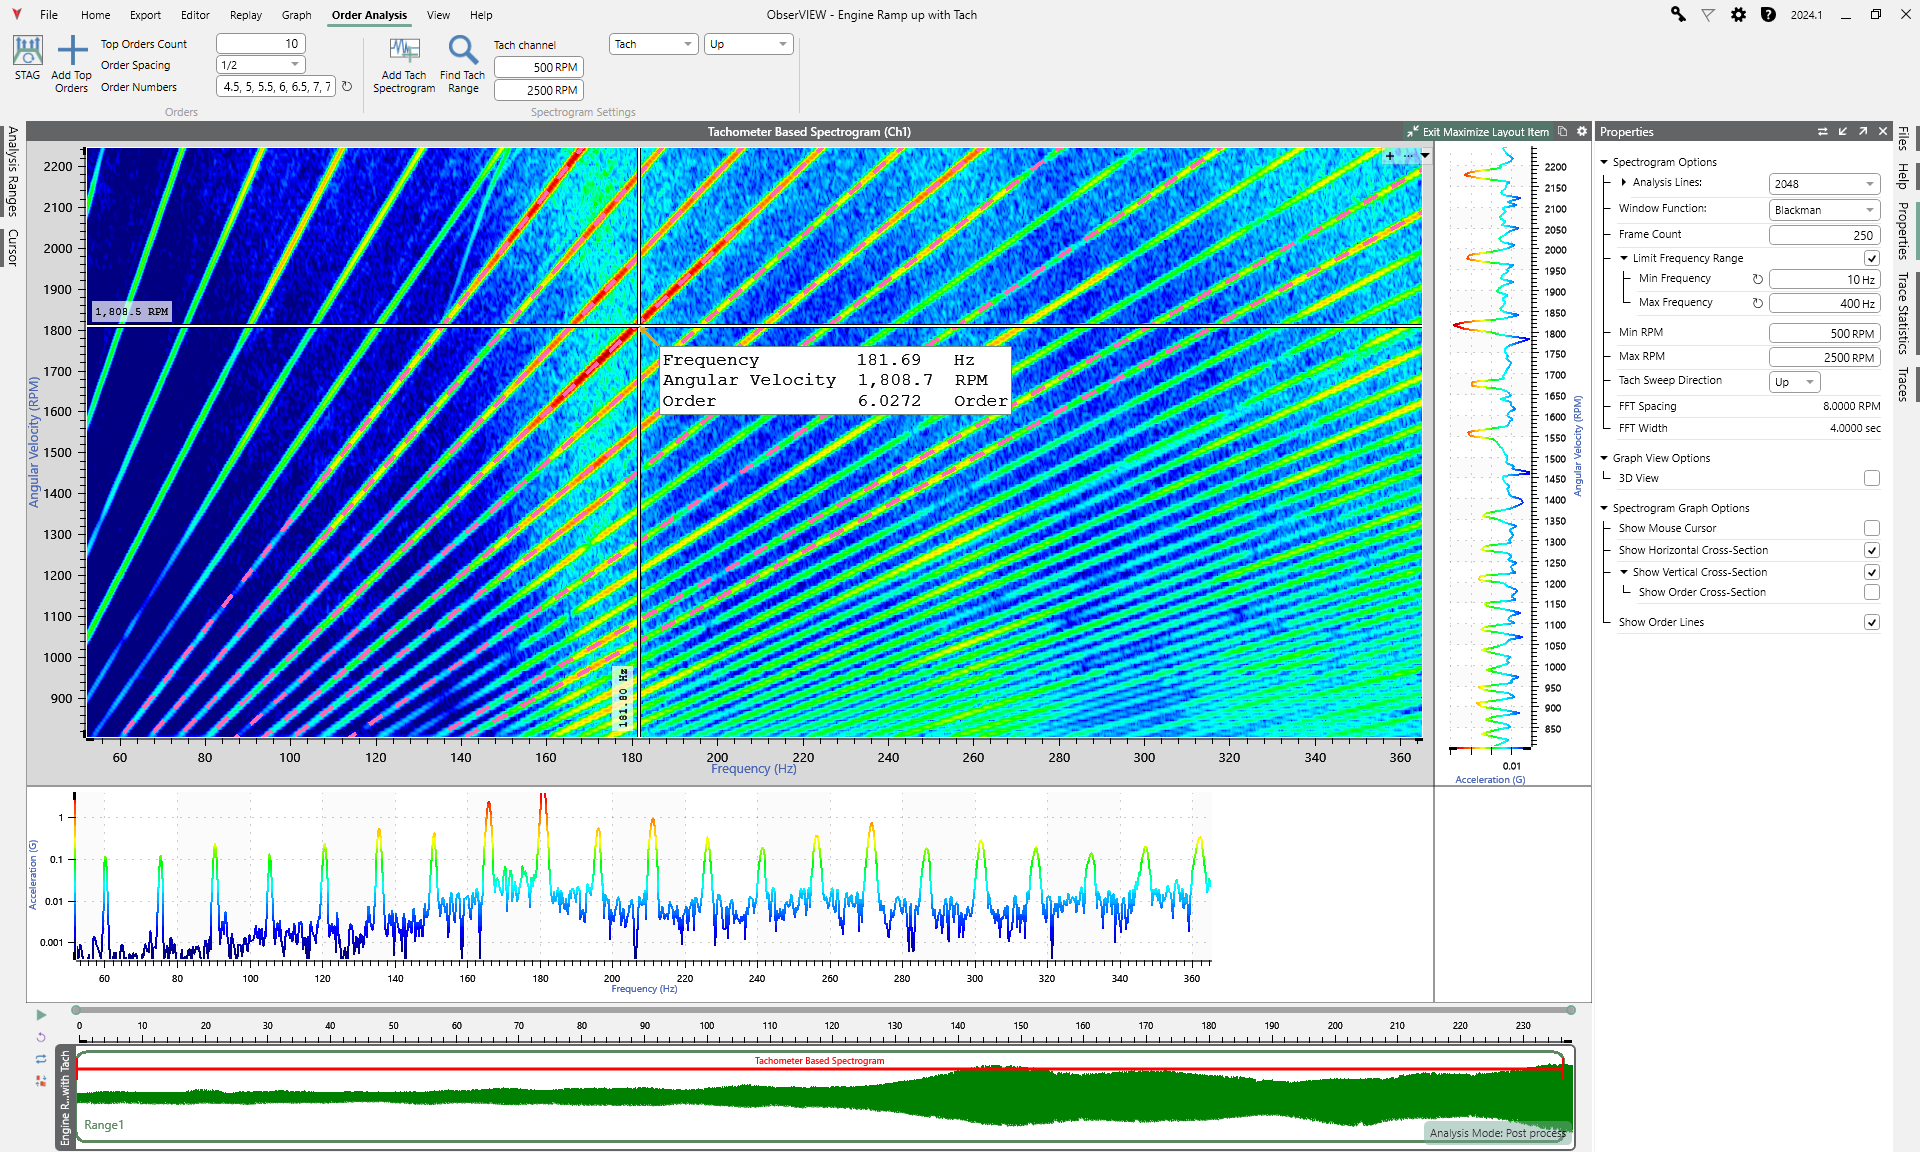
NOTE: If the RPM from the recording is missing or insufficient, the engineer can extract an RPM trace and create a trace with the bandpass tracking filter math function. Alternatively, ObserVIEW can generate a sweeping tachometer trace from a spectrogram if the recording has a stationary measurement.
STAG designates frequencies corresponding to the reference RPM and its harmonics as orders. It extracts the dominant orders to separate the sinusoidal content from the random vibration.
STAG references the dominant orders to define the frequency ranges related to the sinusoidal vibration and accelerates the sinusoidal test profiles. If necessary, the engineer can review/adjust the automated profiles. STAG uses these acceleration parameters for the remainder of the SoR test development process.
Random Test Profiles
STAG processes the remaining random vibration with its FDS software. Using a rain flow algorithm and cycle counting, the FDS accounts for damage from every peak-to-valley stress cycle in the time waveform and converts damage into an appropriate relative damage number for each frequency bin.
When combined, the relative damage numbers constitute the FDS-correlated power spectral density.
Lastly, STAG combines the accelerated sine and random test profiles to create a final SoR test. Engineers can export the test profile to VibrationVIEW for shaker testing.
Why STAG?
Engineers can use STAG to generate an accurate representation of a product environment containing dominant sinusoidal vibration and background random vibration, such as an engine environment.
STAG reduces processing time from tens of hours to seconds and generates an SoR test with high accuracy. Developing an SoR test otherwise is achievable but requires specialized knowledge and significant time. The STAG tool reduces processing time, minimizes potential user error, and directly exports the data to a test profile that can be run on a shaker controller.
Read: Should I Use ObserVIEW’s FDS or STAG?
If you are interested in previewing the STAG software, you can download a free demo of ObserVIEW.