Analyzing a Random Time-History Waveform
February 23, 2021
Analyzing Waveforms
Reproducing Waveforms
Fatigue Damage Spectrum (FDS)
Sine-on-Random (SoR) Test Generation
Shock Response Spectrum (SRS)
Back to: Test Development with Recorded Data
 The Random Import option in VibrationVIEW generates a random test profile from recorded data. First and foremost, however, Random Import can be used to analyze statistics from a time-history recording. The behavior of the original environment can be used to help determine the cause of product failure, validate a test method or standard, or compare a current test to real-world measurements.
Random Import File Statistics
To view the statistics of recorded data, the random import should be an acceleration time-history stored in a text file. The longer the recording is, the more accurate the estimation of the random import will be.
To import a time-history stored in a text file:
- Click New Test > Random
- Click the Advanced button and then Import
- Point to the file options combo box and choose Select Acceleration time history File (Figure 1)
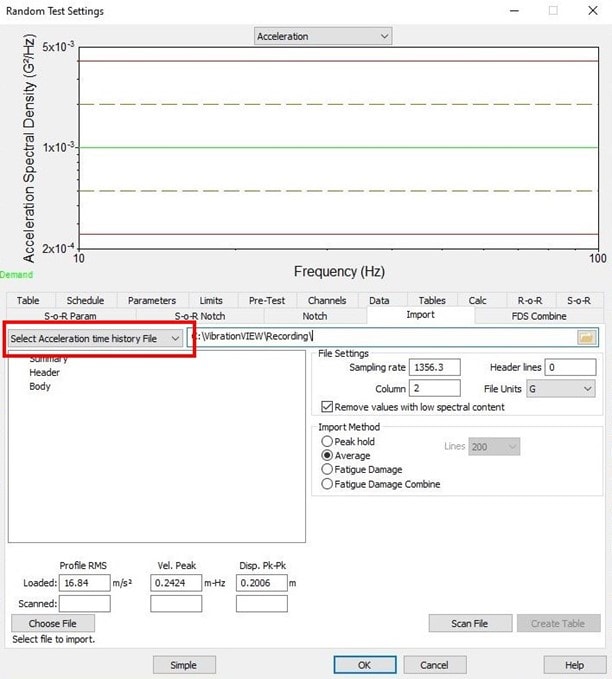
Figure 1. File options combo box.
- Point to Import Method and select the spectrum generation method
- Click the file icon to the far right and select the desired import file. The file must be a supported format (vfw, txt, csv, log, asc, dat, vrp, vrd, or any arbitrary ascii text file)
The file will be scanned using the default settings. When the scan is complete, the dialog box to the left will display a summary of the data and a blue trace for the spectrum will appear on the uppermost graph.
- Point to File Settings and confirm the following information:
-
-
- File Units (if the units are changed, the software will automatically recalculate the spectrum without requiring a rescan)
- Column (the column number where the import should begin)
- Sampling rate
- Header lines
-
If any settings are incorrect, fix the setting and then click the Rescan File button.
File Statistics
The summary in the dialog box will include the following statistics:
- Length (# of samples)
- Peak Acceleration (Positive)
- Peak Acceleration (Negative)
- Peak – Peak Acceleration
- Acceleration (RMS)
- Acceleration Squared Variance
- Crest Factor
- Kurtosis
- Velocity
- Displacement
Header:
- Sample Rate
- Channel Count
- # Of Samples
- Duration (time)
- Channel Layout by Column
These statistics can be analyzed to better understand the end-use environment of the product and generate a more realistic test.
Peak Values and RMS
The peak amplitude for acceleration, velocity, or displacement is the greatest value from the position of rest. A peak value can be measured in both the positive and negative direction, and the measurement between the peak positive and peak negative value is called the peak-peak (pk-pk) value.
The average spectrum of random acceleration is displayed as a power spectral density (PSD) and is measured in the units of G2/Hz. A PSD has a Gaussian, or normal, distribution of data (Figure 2).
Random vibration may not display a defined peak amplitude, although the accepted value is approximately 6 to 8 times the standard deviation or 6-8 sigma. Thus, the amplitude is measured instead by the root-mean-square (RMS) value. The RMS is the “power” of the average deviation from the mean value.
The peak value can be estimated from GRMS. We can assume the peak value by understanding the distribution of the random waveform. For example, Gaussian random vibration has a 4.5 sigma peak distribution, so a 2 GRMS random test would have peak accelerations of 9 Gpk. The crest factor, which is the ratio of peak to RMS, can also be used if the value is known.
Kurtosis
In a Gaussian curve, most of the vibration values are adjacent to zero, meaning higher amplitudes are less frequent. As vibration testing systems have a maximum capability, the system may limit the peak amplitudes. However, real-world vibration can be non-Gaussian. By limiting the peak amplitudes, significant data can be discounted and result in under-testing.
Kurtosis control methods, such as Kurtosion, modify the probability of peak distributions to include a higher probability of higher peak accelerations, thus more closely reflecting the real world. Kurtosis can help to make a random vibration test more realistic and bring a test item to failure more quickly. The kurtosis value is a measurement of the distribution’s extreme values from the mean or the “tails.”
Moving Forward
The Random Import option in VibrationVIEW can be used to create a random power spectral density (PSD) based on averaging or a peak hold import, or a fatigue damage spectrum (FDS) based on recorded time-history file(s) and a user-defined m value. The resulting random test is reflective of the original environment.
Random Import can be used to access FDS, which is the more advanced test development option. However, the peak hold and average import methods are no longer used. We have discussed the current practice of generating a PSD in the Random Testing course and will discuss the generation of the FDS using recorded data in subsequent lessons.