
Introduction to the Shock Response Spectrum (SRS)
March 15, 2022
Analyzing Waveforms
Reproducing Waveforms
Fatigue Damage Spectrum (FDS)
Sine-on-Random (SoR) Test Generation
Shock Response Spectrum (SRS)
Back to: Test Development with Recorded Data
In the research and development stages of manufacturing, shock testing helps determine the performance of a test item during and after a transient event. A classical shock test employs regular shock pulses with a set acceleration over time. However, unidirectional classical pulses cannot replicate many transient events that occur in the real world.
The shock response spectrum (SRS) is a testing tool for complex shock. It is a mathematical model that allows test engineers to examine the theoretical response of their device under test (DUT) in the event of a complex shock. Examples of “complex” events—i.e., high-frequency and multidirectional—include earthquakes, rocket separation, and shipboard shock. SRS testing software synthesizes a pulse that drives a shaker to simulate a transient event and models the DUT’s theoretical response to the event.
Classical shock tests function to excite the DUT’s resonant frequencies. The purpose of complex shock tests like the SRS is to evaluate the DUT’s response to a shock event likely to occur in the operational environment. The SRS is a theoretical response to a transient event, and unlike classical shock, it displays data in the frequency domain.
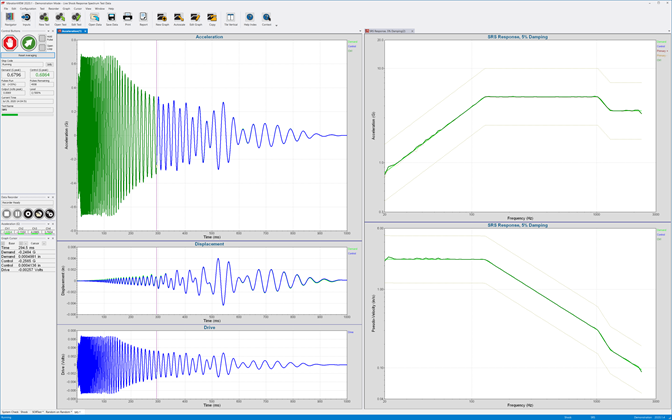
Live SRS data in VibrationVIEW.
Development of the SRS
In the 1930s, engineers were investigating methods to determine the resistance of buildings to earthquakes. They observed the response of buildings and bridges to seismic activity but did not consider the input of long-duration and complex seismic waveforms.
Dr. Maurice Biot first introduced the SRS in his 1932 Ph.D. dissertation.1 He defined it as the “maximum response motion from a set of single DOF oscillators covering the frequency range.”2 Improvements have been made to the technique since then, but the SRS is still an accepted method of shock testing.
While Biot originally developed the SRS for quantifying the response of structures to earthquakes, many industries now use it for product development and testing. Seismic testing is recommended or required for building construction, critical systems, nuclear power, lighting, and power distribution. The aerospace industry uses the SRS for takeoff and landing, ejection seats, and separation events. Military and defense contractors use it for naval shipboard shock and live fire, near-miss.
The following are several test specifications for seismic testing.
- IEEE-344: seismic qualification of electrical equipment in nuclear power plants
- ASME NQA-1: nuclear quality assurance requirements
- Bellcore (Telcordia) GR-63: seismic qualification of telecommunications equipment; defines five zones across the USA of varying seismic activity matching Uniform Building Code (UBC) (generally not used for nuclear power plant equipment)
- QME-100: ASME standard; seismic qualification of mechanical equipment
- ICC-ES AC-156: requires structures and equipment to maintain integrity despite earthquakes
- ISO 4866.2010: measurement of vibration and evaluation of the effect on structures
- ISO/TS 10811-1:2000: vibration and shock in buildings with sensitive equipment
Single Degree-of-Freedom (SDOF) Systems
A single mass connected to a spring represents the most simple vibratory system. The mass can only travel along the direction of the spring’s elongation. Therefore, the system has a single degree of freedom (SDOF).
The SRS uses a set of theoretical SDOF mass-damper-spring oscillators that are mathematically excited by a time-history base input. The SRS displays the peak response of the series on a graph (Figure 2). It is important to note that the SRS is not the actual response of the test item but what could theoretically be the response.
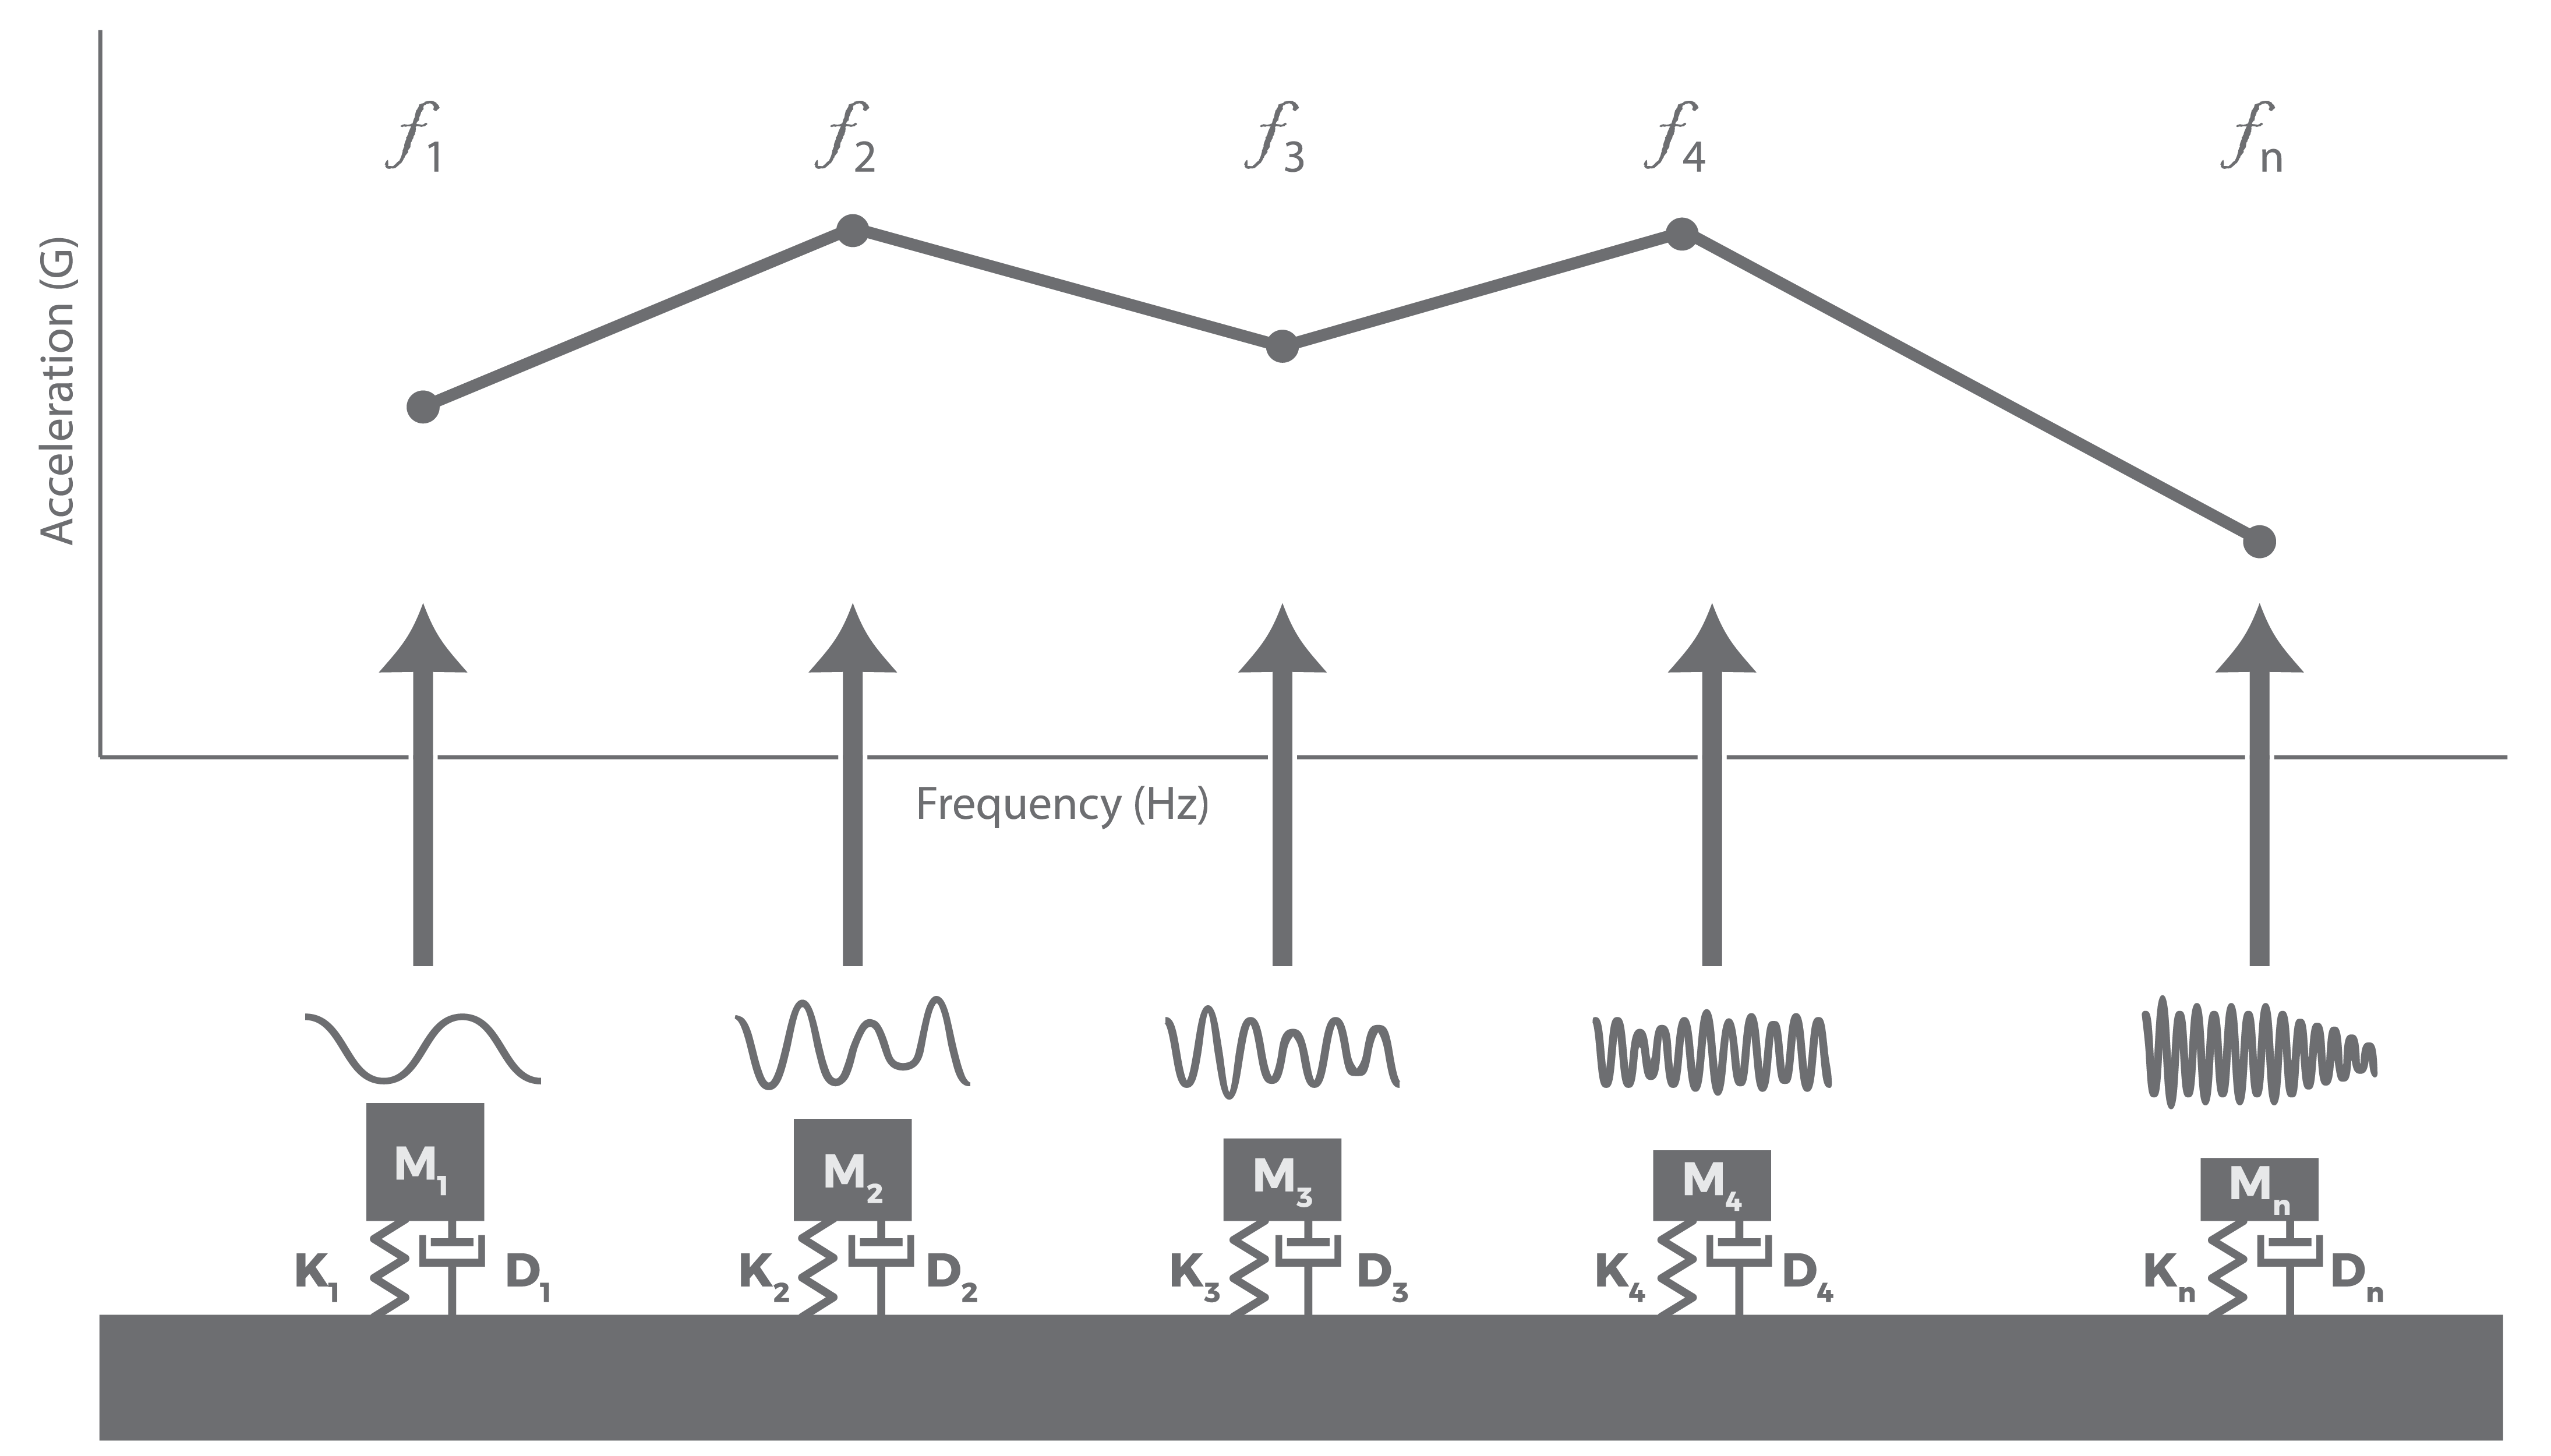
A basic model of the SRS featuring a graphical representation of a series of single-degree-of-freedom oscillators.
The horizontal axis of the SRS plot is the natural, or resonant, frequency in hertz (Hz). The resonant frequencies of the SDOF oscillators are logarithmically spaced. The vertical axis is the absolute maximum acceleration of the SDOF oscillator in response to the pulse, a value also known as the maximax (Gpk).
The oscillators are also characterized by either the critical damping factor (ζ) or resonant gain (Q), where Q = 1/2ζ. The same value applies to all the oscillators (normally ζ = 5%, Q = 10).
Validity of the SRS
Acceleration pulses that differ in amplitude, frequency content, and duration can produce equivalent shock spectra, resulting in an extensive process of waveform selection. Despite this, SRS remains a standard tool for complex shock testing. The SRS method characterizes a shock environment in a straightforward manner, and engineers can define a test with data from multiple shock events.
Engineers use the SRS to generalize a transient event, estimate the event’s damage potential, or perform data analysis. It also functions to identify resonances, define test specifications (particularly for seismic tests), and replicate failure modes.