Kurtosis
March 29, 2018
Getting Started
Power Spectral Density
Converting Recorded Data
Statistics & Probabilities
Test Control
Back to: Random Testing
Kurtosis describes the deviation of a data set’s peak values from the mean. It calculates the signal’s average deviation from the mean to the fourth power divided by the standard deviation to the fourth power. Equation 8 gives the kurtosis for a set of numbers, xn, n = 1, …, N.
(1) 
Equation 8
Kurtosis is dimensionless, meaning it has not units. For a random variable with normal (Gaussian) distribution, k = 3. For example, the turbulent pressure signal in Figure 3.3 has a value of k = 2.6, which is near the expected value.
Some computer programs calculate the excess kurtosis value as k – 3. In this case, a normal distribution would have an excess of 0.
Probability Distribution
Kurtosis is a ratio of statistical moments, which are parameters that describe the shape of a data distribution. More specifically, it is the fourth statistical moment divided by the square of the second statistical moment (variance). A data set’s statistical moments define its probability distribution.
On a graph of a data set’s distribution, the kurtosis measures the distribution “tails.” A data set with a high k value will have a distribution curve with a higher peak value at the mean and longer tails. In other words, more data points will be at the extreme values from the mean.
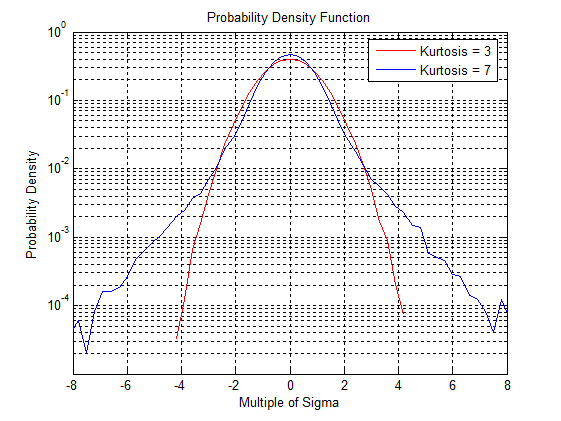
Comparison of two data sets’ distributions with different kurtosis values.
- High k: A sharper peak and heavier tails; more values near the mean and extremes
- Low k: A flatter peak and lighter tails; fewer extreme values and a more uniform distribution
Kurtosis helps identify outliers and assess the damage potential of vibration data. In many engineering applications, a higher value suggests more damaging events, as the data spend more time near extreme values.