Cross-spectrum (CSD) Graph
January 3, 2019
Getting Started with Analyzer
Primary Graphing Functions
Back to: VibrationVIEW Analyzer Software Package
Cross-spectrum is an Analyzer graph option in the VibrationVIEW Random and Shock test modules.
The cross-spectrum graph is beneficial when looking for a relationship between two waveforms in a particular frequency band. If the waveforms’ amplitudes differ, but their frequency content shows similar characteristics, one waveform’s activity may be causing acceleration spike(s) in the other.
Alternatively, the two signals may share a resonance, or there may be noise or another external factor affecting both waveforms.
What is CSD?
The cross-spectrum graph displays the cross-spectral density (CSD) for a signal pair. The CSD is a Fourier transform of the cross-correlation function. It estimates the distribution of power for a frequency range. Learn more about the mathematics of this estimation in the Cross-spectral Density Mathematics lesson.
The value of the CSD indicates the influence of signal x in relation to signal y. The area under the CSD curve from frequency f1 to frequency f2 is the power (RMS) in that band of frequencies. A zero value would indicate that the signals are not at all correlated.
If the CSD has a main lobe, then the pair of signals have some degree of correlation. Generally, the wider the main lobe, the more uncorrelated the pair is, and the narrower the main lobe, the more correlated the pair is.
The CSD can also indicate mutual resonant frequencies in a pair of signals. A CSD with a spike at some frequency (f) indicates that the pair of signals is periodically correlated every 1/f seconds. The correlation may be due to a mutual resonant frequency at f. A CSD with a single spike at 0Hz is likely due to the presence of a large DC offset in both signals.
The CSD and PSD
The cross-spectral density is similar to the power spectral density (PSD). The PSD displays the power of a signal over a defined frequency range. The frequency distribution clearly defines resonances and harmonics compared to a time waveform.
We use the PSD to analyze the frequency content of random waveforms. Likewise, we can use a plot of the CSD to compare two random waveforms for a particular frequency band. The cross-spectrum graph can also be applied to shock waveforms. Analysis in the frequency domain may reveal similarities hidden in the time domain.
Phase Information
A time delay in measurement is possible when comparing signals from two sources. Consequently, there also will be a phase difference between the two signals. The CSD contains data about these differences if the peaks are statistically significant.
The cross-spectrum plot is similar to the transfer function graph because they both provide information about the amplitude and phase of two waveforms. However, the CSD describes the correlation between two signals, and the transfer function describes the relationship between the input and output.
In practice, both are useful for gathering insight into testing behavior, and engineers should use them together.
Cross-spectrum and Multi-axis Testing
The cross-spectrum graph is beneficial when studying multi-axis systems, as it can determine how the vibrations in one axis are affecting the vibrations in another.
In the past several decades, the vibration testing industry has improved methods of multi-axis testing. Although a multi-axis test is closer to real-world vibration, the motion from multiple directions poses new challenges. Excitation in one direction may affect the response on a different axis. If the engineer notes acceleration activity that is unrelated to the DUT’s response, they can use the cross-spectrum graph to compare the responses of different axes.
For example, consider the following multi-axis system (Figure 2.6). An aluminum mass is mounted on a thin steel rod vibrating on the vertical axis.
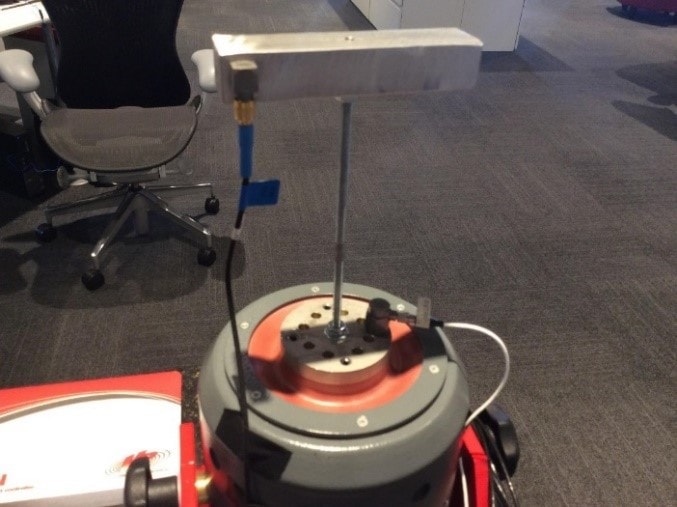
Figure 2.6. Large aluminum mass mounted horizontally on a thin steel shaft. A triaxial accelerometer is mounted on the end of the horizontal mass.
Vibration may excite an object into a rotational or rocking motion. If this occurs, the object will have an x-axis component every time it vibrates on the z-axis. With a multi-axis vibration, the test engineer can use cross-spectral density to determine if there is a relationship between the motion.
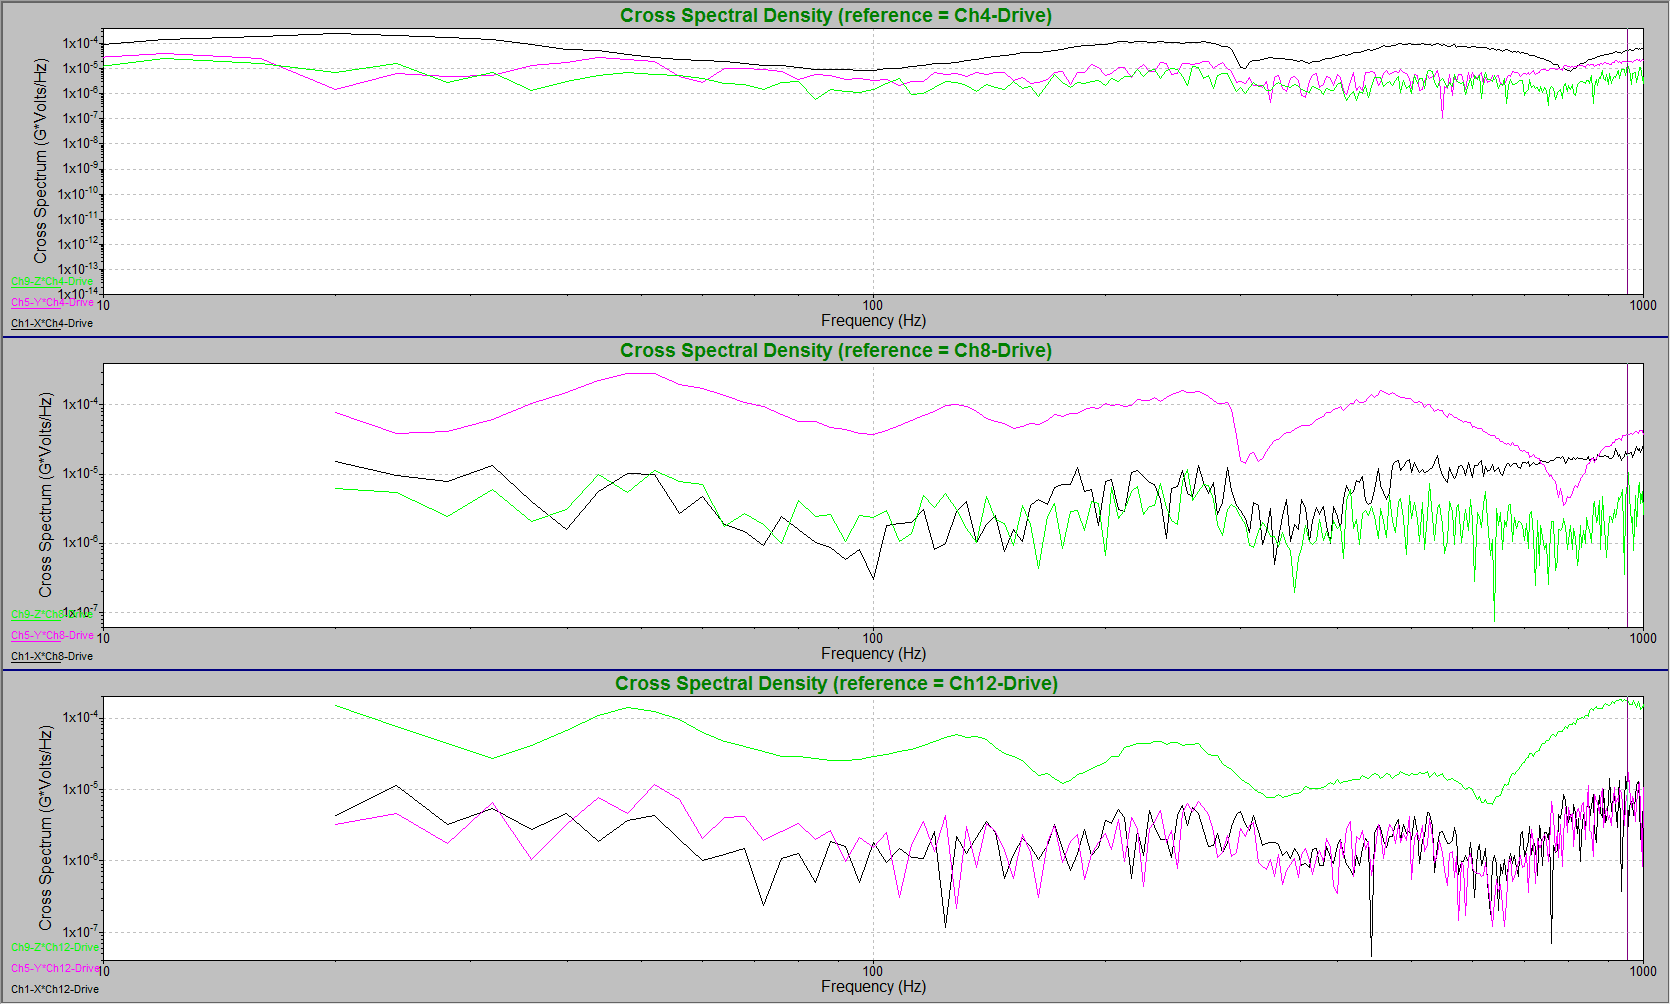
In the following cross-spectral density plot, there is no significant signal in the x- or y-axes for most of the spectrum. However, at approximately 60Hz, 300Hz, and 400Hz, the vertical vibrations excite the x- and y-axes (Figure 2.7).
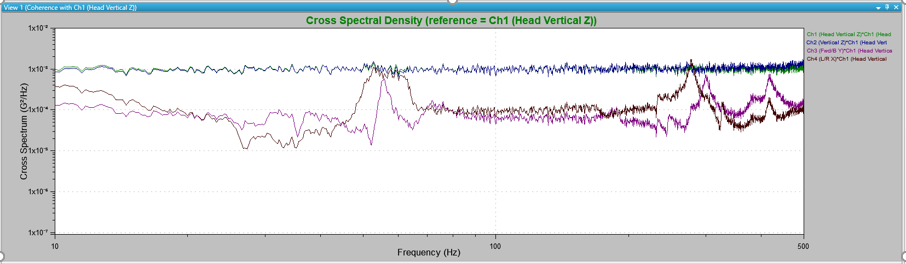
Figure 2.7. Cross-spectral density plot for a multi-axis system. The vibrations across the spectrum that should affect the z-axis only also affect the x- and y-axes at certain frequencies.
Conclusion
Engineers can use the cross-spectrum graph to compare two random waveforms/shock events for a particular frequency band. Its values indicate the influence of signal x in relation to signal y and can also point to mutual resonant frequencies in a pair of signals. A cross-spectral density plot is often used to determine if the vibrations in one axis are affecting the vibrations in another