Total Harmonic Distortion (THD)
January 3, 2019
Getting Started with Analyzer
Primary Graphing Functions
Back to: VibrationVIEW Analyzer Software Package
THD is an Analyzer graph option in the VibrationVIEW Sine test module.
An ideal sine tone is smooth and without distortion. In reality, however, many events can affect a pure sine wave. Specifically, the potential energy in the harmonic content of the system leads to distortion.
A harmonic is a wave whose frequency is a whole number multiple of a fundamental frequency. For example, the harmonics of a 60Hz sine wave are 60Hz, 120Hz, 180Hz, and so on. Any energy in these harmonics will distort the 60Hz sine wave.
Total Harmonic Distortion
Total harmonic distortion (THD) measures the total harmonic content in a sine wave. When a signal passes through a non-linear device, additional frequency content is added to the harmonics of the original frequencies. THD measures the extent of that distortion.
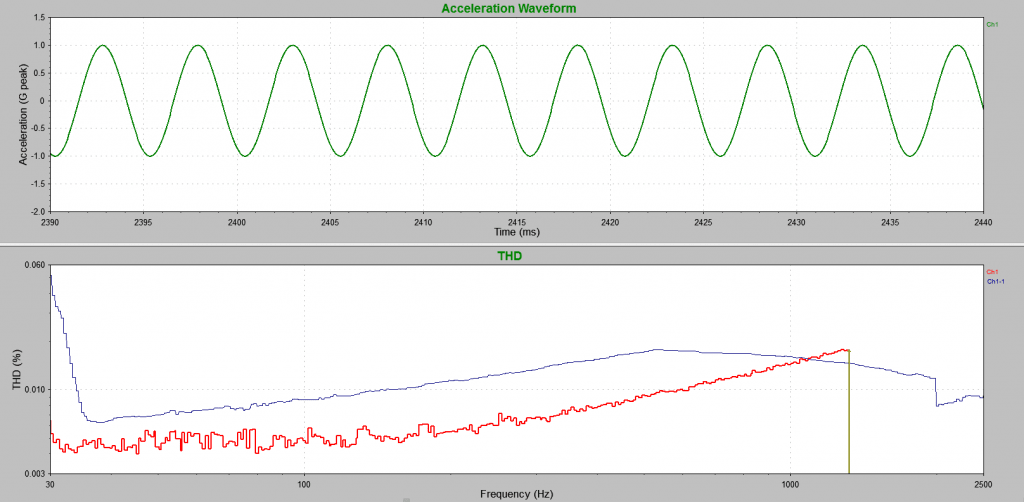
Percent-THD of a sine waveform.
THD expresses a different meaning depending on the application. For example, lower distortion levels in audio systems mean that the components in a loudspeaker, amplifier, microphone, or other equipment produce a more accurate signal reproduction. In vibration testing, THD helps quantify how well a system replicates the signal from the controller.
THD Calculation
The VibrationVIEW software calculates THD as a ratio of the root-mean-square (RMS) acceleration of the first ten harmonic frequencies (starting with the second harmonic) over the RMS acceleration of the fundamental frequency.
(1) 
Vn = RMS voltage of nth harmonic
V1 = RMS of fundamental frequency
THDF is common in audio distortion specifications (%THD) and is usually expressed as a percentage or in decibels (dB).
THD Values
THD measures how accurately a vibration system reproduces an output signal from the controller. A low THD value indicates that the system is performing correctly, whereas a high THD value is indicative of a problem with the system.
A test engineer can use the THD value to identify noise or unwanted vibrations that can result in inaccurate/invalid test results. Potential uses for THD are shaker validation testing, fixture mapping, and product screening.
A high THD value (>10%) indicates significant harmonic content in the sine signal, possibly due to some weakness or malfunction in the shaker system. As the mechanical components of a shaker degrade over time, more noise will be introduced into the system, and the percent-THD value will increase. Engineers should expect a high THD value if they compare two unrelated signals, such as waveforms from two separate axes.
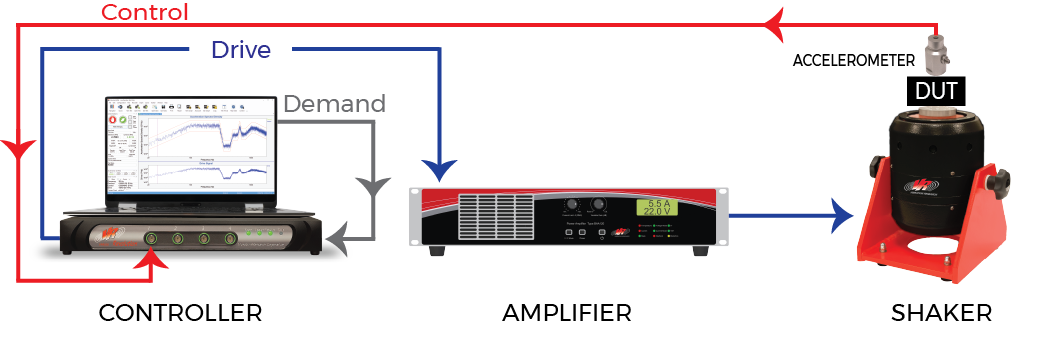
Engineers might also check for high THD values in data from multi-axis testing. For example, a shaker vibrating with a pure sine tone in the vertical axis should only excite the device under test (DUT) in the vertical axis. If an accelerometer measures vibration in the horizontal axis, the THD value will be high.
When an engineer compares two signals with a similar vibration, they should expect a low THD value. A lower percent-THD value indicates easier system control. In the case of a new system or component, the test engineer should measure the system’s THD value. Moving forward, they can use the THD to measure the accuracy of the vibration system and help track system changes over time.
Learn more: Preventative Maintenance VRU course.
Total Harmonic Distortion for Validation
The following example demonstrates how THD can be helpful for shaker validation testing.
Two tests were run on a shaker: one with a shaker in a healthy state and the second with a loose piece of equipment rattling on the head expander (such as a loose bolt or a damaged fixture/shaker). The THD of the head expander with all bolts firmly tightened produces a much different response compared to the THD of the same setup with a loose wrench on the head expander (Figure 2.8).
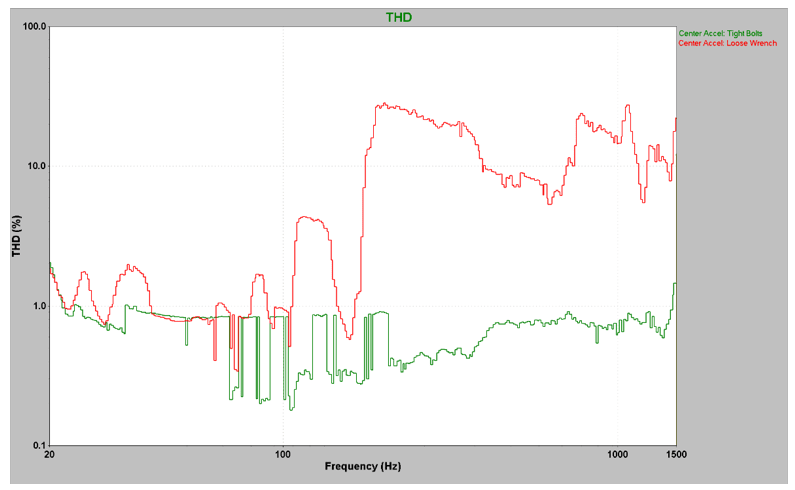
Figure 2.8. THD vs. Frequency for two tests. The green trace represents a healthy shaker system, and the red trace represents a damaged shaker/fixture, a loose bolt, etc.
THD in Multi-axis Testing
An aluminum mass was mounted on a thin steel rod vibrating in the horizontal plane (Figure 2.9). A triaxial accelerometer was adhered to the end of the mass.
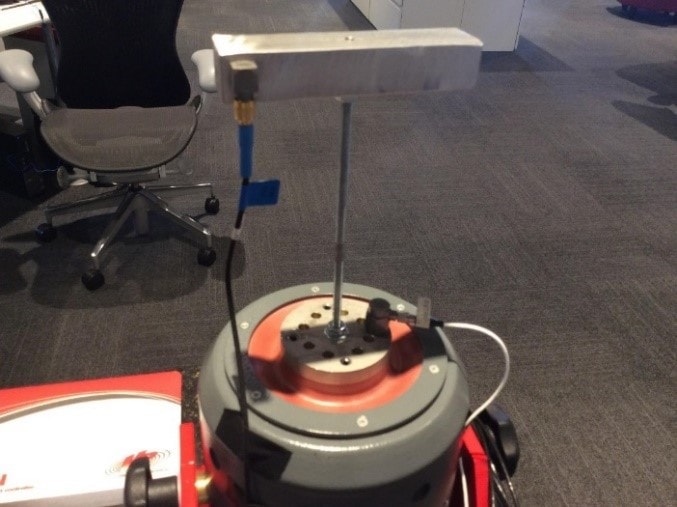
Figure 2.9. A large aluminum mass mounted horizontally on a thin steel shaft. A triaxial accelerometer is on the end of the mass.
The THD values of the three axes were compared to the vibrations of the shaker head (Figure 2.10). The vertical axis vibrations moving in the same plane as the shaker head produced a THD similar to the shaker head across the frequency spectrum.
The remaining two axes produced different THD values than the shaker head across most of the spectrum, meaning there was no significant vibration in those planes at those frequencies. However, these other axes had similar THD values as the shaker head at approximately 45Hz and 110Hz. This similarity indicates that the energy of vibrations in the vertical plane excited vibrations in the other planes at those frequencies.
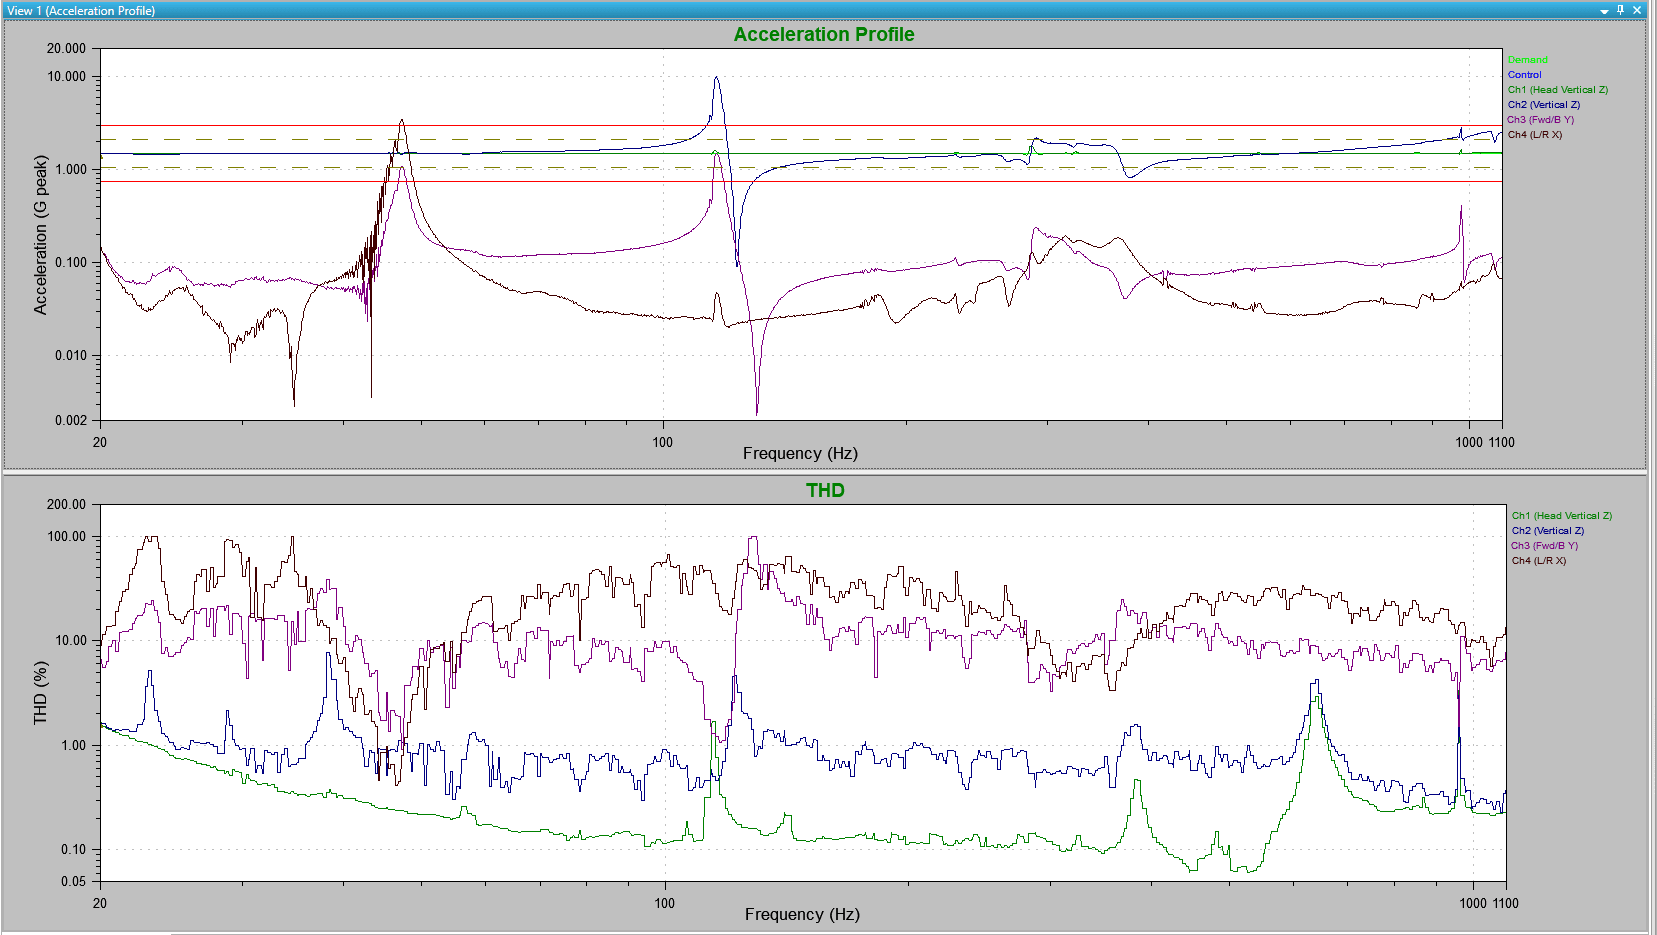
Figure 2.10. THD of three axes at the end of a large horizontal mass vibrating in the vertical plane. The vertical axis of the accelerometer has a similar THD as the vertical vibrating shaft. The other two axes have much higher THD values.
Swept THD
A test engineer can evaluate shaker performance by running a sine sweep and analyzing the data with the THD. First, they should establish the shaker’s THD when it arrives at the laboratory testing facility. The value should be less than 10% across the frequency spectrum.
After the engineer establishes a baseline THD, they can compare any future THD responses to the original value. If the response varies from the baseline, then there is likely an issue with the shaker.
While we can analyze data from a sine sweep test in many ways, VR recommends using the THD plot to evaluate shaker performance because it provides clear visual clues if something is awry with the shaker system.
The THD method covers an entire range of frequencies and not just an isolated, single frequency (such as in System Check). Additionally, engineers use sine sweeps to produce shaker performance standards, so it is logical to evaluate shaker performance with the same type of test.
Conclusion
THD can compare how accurately a vibration system reproduces the output signal from a controller. Engineers can use it to evaluate the quality of a controller, determine the health of a shaker system, and locate unwanted vibrations in a DUT.