Coherence Graph
January 3, 2019
Getting Started with Analyzer
Primary Graphing Functions
Back to: VibrationVIEW Analyzer Software Package
Coherence is an Analyzer graph option in the VibrationVIEW Random and Shock test modules.
The coherence graph displays a statistical relationship between two signals at the same frequency.
The coherence of two signals, x and y, depends on the phase difference between the signals. It is a normalized value, so it does not specify if the signals are in or out of phase. Instead, a coherence value of 1 indicates that the waveforms’ phase difference is consistent for one or multiple samples, and a value of 0 means the difference in their phase has changed.
Rather than providing specific phase values, coherence indicates if the phase difference changes for the defined frequency. This information allows the engineer to evaluate the relative motion between signals.
Calculating the Coherence Function
The coherence function implements the power-spectral density and cross-spectral density (CSD) of signals x and y. Calculating the magnitude-squared value produces information about the relationship of the signals but removes the associated phase values. Learn more about the mathematics of this estimation in the Coherence Mathematics lesson.
The variance of the coherence function reduces with more data samples. The estimated coherence depends on the number and duration of the individual samples.
Averaging
Averaging is one method of reducing variance. In VibrationVIEW’s Shock test settings, for example, the average number of pulses field determines the maximum number of pulses the software averages to compute the cross-spectrum. It uses the averaged cross spectra to generate and display the coherence plot.
For a pair of independent waveforms, the coherence levels will approach 0 as the number of samples in the average increases. If there is a low number of samples, you would expect the independent waveforms to show relatively high coherence values.
However, if the waveforms are dependent, increasing the amount of averaging will not change the coherence but will provide a better estimate of the true non-zero value.
Windowing
The engineer can also apply a window function to the signals. VibrationVIEW uses Welch-type algorithms to compute the CSD from a product of Fourier transforms, and the user can adjust the number of samples and overlap percentage.
Learn more: Window Functions for Signal Processing VRU course.
Uses for the Coherence Graph
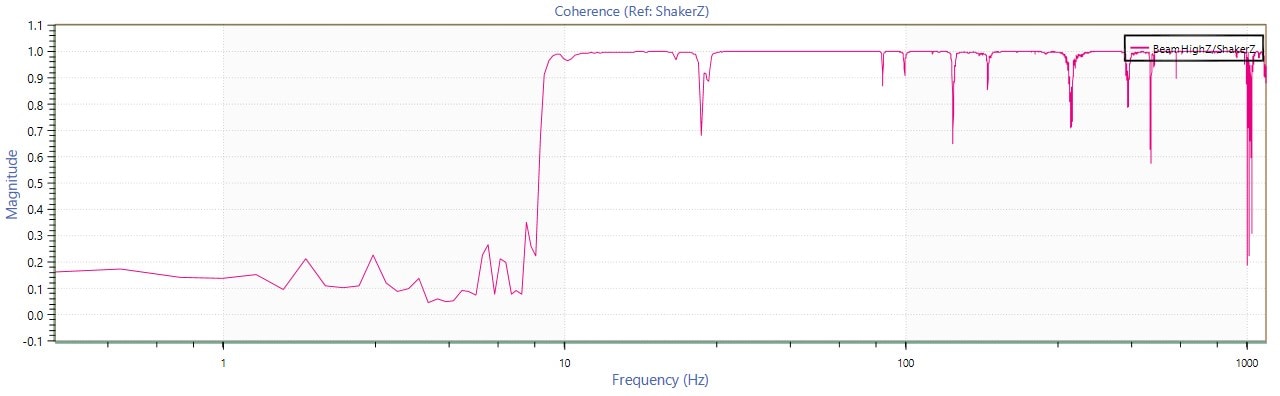
Coherence can help determine the linearity of a control system at a specified frequency. A coherence value near 1 indicates that the system is linear time-invariant at frequency f and confirms that the controller is capable of control at f.
A coherence value near zero indicates that the system is non-linear, statistically changing with time, or both, signifying a low quality of control. A near-zero coherence value may be the result of poor controller performance, system noise, or another component issue, such as a damaged cable.
Engineers can also use coherence alongside the transfer function graph to determine if a peak is due to resonant frequency or measurement noise.
Evaluating the Motion of Components
The coherence graph can function as a diagnostic tool. For example, if two components should remain 180° out of phase, the coherence between their response signals should be 1. If there is a low coherence, then one of the components may be slightly out of phase and need replacing.
In multi-axis systems, the coherence plot can demonstrate how the vibrations in one axis affect the vibrations in another. Consider the following test results from a vibrating mass of aluminum supported by a thin steel rod. A triaxial accelerometer measured the vibration at the end of the mass (Figure 2.4).
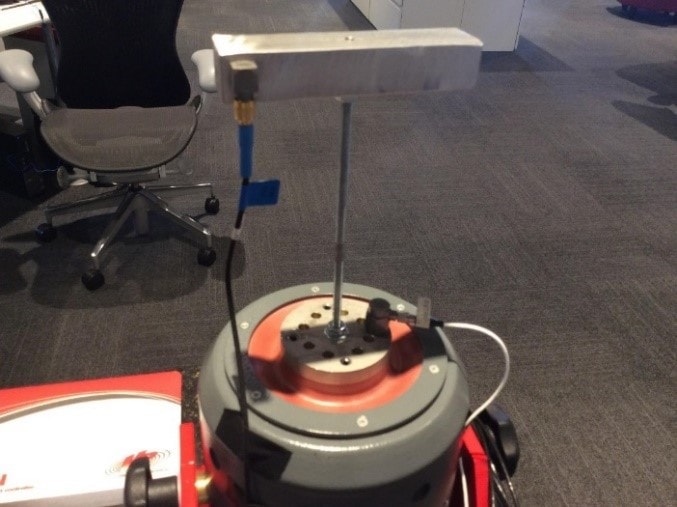
Figure 2.4. Large aluminum mass mounted horizontally on a thin steel shaft. A triaxial accelerometer is mounted on the end of the horizontal mass.
As the beam vibrates in the vertical plane (z-axis), one would not expect much vibration in the horizontal planes (x and y-axes). However, the energy of the vertical vibrations excites vibrations in the other planes at certain frequencies (Figure 2.5). Consequently, the coherence values differ because there is no longer a constant phase difference.
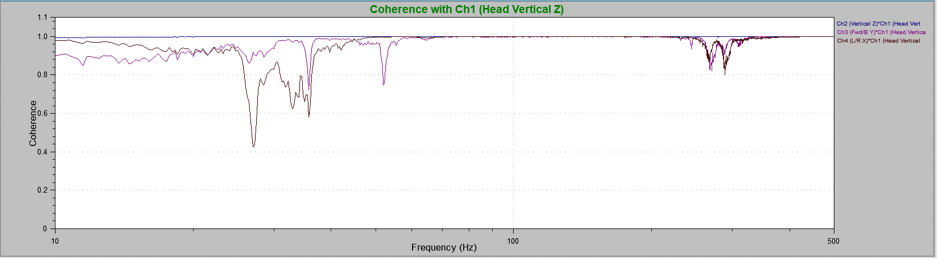
Figure 2.5. Coherence plot for aluminum mass vibrations in the x-axis (Ch.3) and y-axis (Ch.4) compared to shaker head vibrations (vertical; Ch.1). At several frequencies, the x- and y-axes do not correlate with the vertical axis vibrations.
IEEE-344 Parameters
IEEE 344 covers the recommended practice for Seismic Qualification of Class 1E Equipment for Nuclear Power Generating Stations. The standard requires a coherence plot, among other statistics. The coherence plot can demonstrate the frequency stationarity of transient event data.
Conclusion
The coherence plot displays the relationship between signals at a particular frequency. It can help determine the linearity of a control system at a specified frequency and evaluate the motion of components.