What is the Fatigue Damage Spectrum (FDS)?
December 11, 2020
Analyzing Waveforms
Reproducing Waveforms
Fatigue Damage Spectrum (FDS)
Sine-on-Random (SoR) Test Generation
Shock Response Spectrum (SRS)
Back to: Test Development with Recorded Data
The power spectral density (PSD) is a standard tool for analyzing and characterizing random vibration. A random PSD test profile is comparable to the reference vibration environment within a set time and frequency range.
Test specifications often provide a PSD test profile to run on a shaker table in the laboratory. A random profile excites all frequencies within the range, and engineers run the test until the product fails with the goal of identifying potential weaknesses.
But what if we want to analyze a product’s total life damage?
Often, test engineers want to know how a product will withstand the accumulation of damage over many years. It is not practical to run a PSD profile for 100+ hours. Additionally, the PSD does not reflect the damage incurred from multiple environments.
Instead, engineers use fatigue estimation methods to predict product life expectancy and anticipate failures that may occur with a lifetime of standard use.
What is the Fatigue Damage Spectrum?
According to Miner’s rule of damage1, all structures experience fatigue when repeatedly exposed to significant stress levels, and fatigue accumulates over time.
Vibration-induced stress accumulates material fatigue, which is a leading cause of product failure. Engineers run products to their breaking point to determine how long they can withstand the end-use environment and make design improvements. Engineers do not want to spend any more time than is necessary to reach these goals.
The fatigue damage spectrum (FDS) measures the relative potential for stresses associated with resonant responses to cause fatigue failure. Engineers can use it to statistically simulate a product’s end-use environment.
FDS software can accelerate a random PSD test profile to a desired test duration by increasing system energy. It can also combine different vibration environments and weigh them based on their contribution to the life of the product in a standard environment.
FDS Calculation
The FDS computation in Vibration Research software is based on Miner’s rule of damage. According to this damage model, fatigue damage accumulates with exposure to stress cycles at different stress levels.
Damage Calculation (Equation 1)
(1) 
Equation 1
Where:
- k is the stress levels
 is the number of stress cycles at ith stress level (
 )
) is the average number of cycles to failure at
 - C is the fatigue/endurance limit
According to Miner’s rule, a product will fail when the fatigue limit (C) exceeds a value of 1.
Calculation Overview
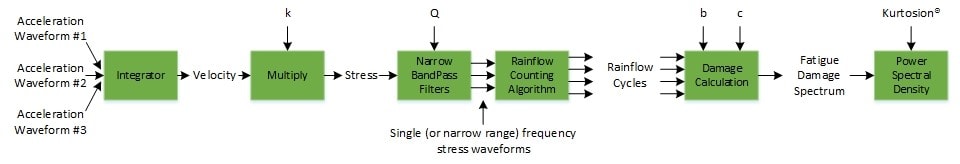
To calculate a fatigue damage spectrum, Vibration Research software uses one or multiple time-history files. Applying user-defined target life values, it weighs multiple files based on their contribution to product life in a standard environment.
Next, the software applies narrowband filters to the weighted waveform. Typically, these filters are spaced at an octave value (1/3 octave, 1/12 octave, etc.).
A rain flow algorithm counts the peak-to-valley stress cycles at each frequency band, and the stress cycle amplitudes are weighted non-linearly based on the power-law function of Miner’s rule. The combined stress cycles illustrate the fatigue of the product at each given frequency.
The software uses the m value and resonance factor (Q) to calculate the fatigue damage value for each single/narrow range frequency waveform. The resulting FDS is made up of these damage calculations.
For test purposes, engineers can convert an FDS into a random PSD test profile using Henderson-Piersol’s potential damage spectrum.2 The FDS-correlated PSD test profile is a cumulative spectrum that represents the relative damage experienced by the product for the combined and weighted environments.
Non-Gaussian Waveforms
As the FDS applies rain flow analysis and cycle counting to time-waveform data, it accounts for every peak-to-valley stress cycle. Therefore, it accounts for any non-Gaussian features of the waveforms.
Other fatigue estimation methods use a frequency domain conversion before performing the damage calculation. This process assumes the data are Gaussian and often results in under-testing.