Create an ObserVIEW Project
March 31, 2021
Back to: Getting Started with ObserVIEW
In ObserVIEW, users can open, view, and edit time waveforms, playback data with synchronized media, develop test profiles from recorded data, and more. The next several lessons will help you to navigate options within the software.
![]() The question mark icon in the title bar enables Context Help mode. After enabling Content Help, click anywhere in ObserVIEW, and the software will direct you to the appropriate section of the Help file.
The question mark icon in the title bar enables Context Help mode. After enabling Content Help, click anywhere in ObserVIEW, and the software will direct you to the appropriate section of the Help file.
Open, Close, and Save Projects
To open a file, select File > Open. Select the Recording (VFW), Project, or File button to open a recording or project. ObserVIEW creates a project (.obserproj) every time a file is opened or a hardware device is connected to the software.
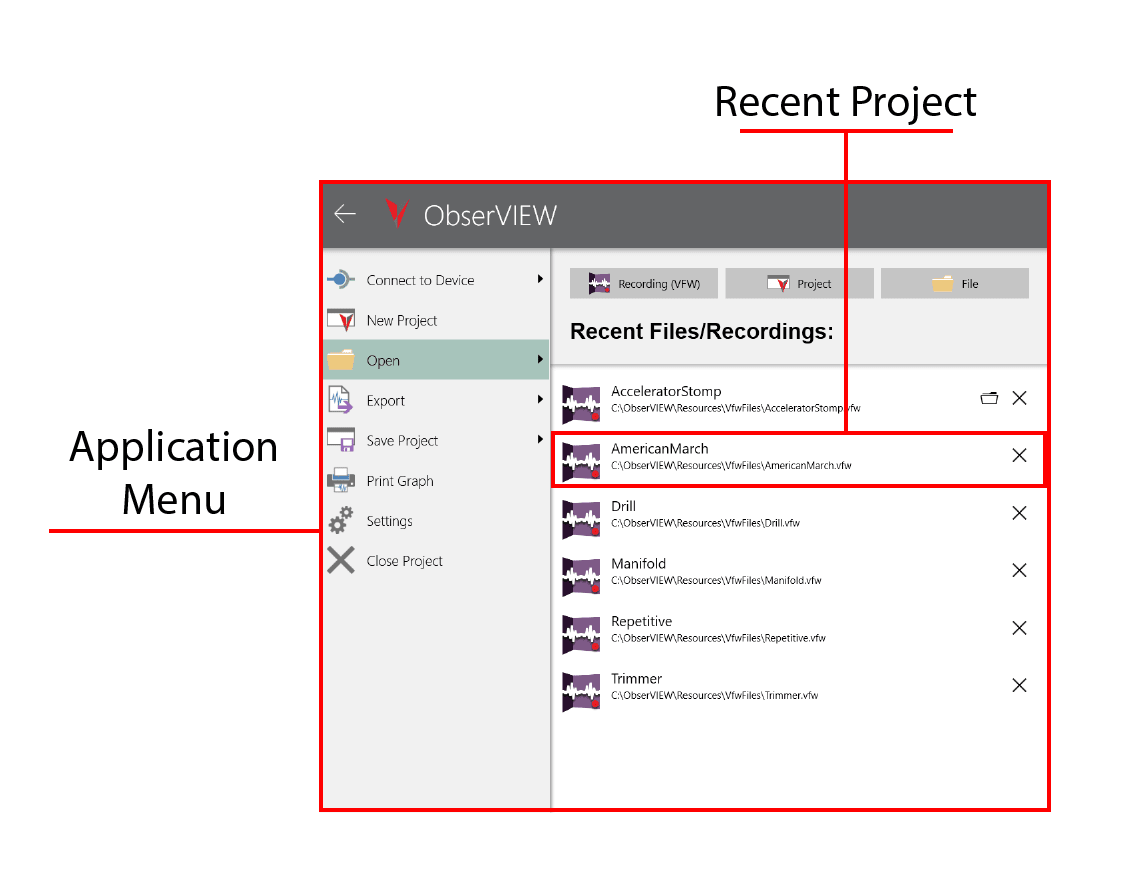
Open options in the application menu.
ObserVIEW can import 100+ GB of data from any data acquisition device. ObserVIEW supports VibrationVIEW waveform files (.vfw), ObserVIEW projects (.obserproj), and .csv, .txt, .rpc®, .uff, and .wav files. The user can import files from non-Vibration Research hardware so long as the file type is compatible.
The Recent Files/Recordings pane contains a list of recent projects. Select an item from this list to restore the project to its most recent state.
- To create a new ObserVIEW project, select File > New Project
- To save a project, select File > Save Project; the software will save the file with a *.obserproj extension
- To close a project, select File > Close Project
Batch File Processor
The Batch File Processor is an interface where the user can employ ObserVIEW’s command-line capabilities before opening a file. They can modify one or multiple files with filtering or resampling, select the conversion file type, and more. To access this interface, select File and navigate to the bottom of the application menu. Under Tools, select the Batch File Processor option.
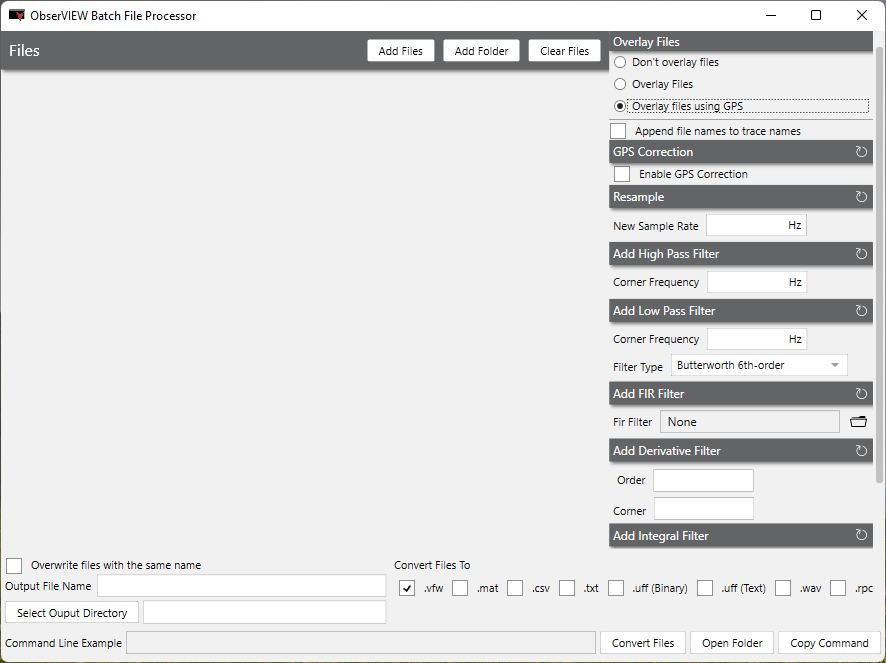
ObserVIEW Batch File Processor dialog.