gRMS as a HALT Metric
August 21, 2023
HALT Vibration Testing
Back to: HALT Vibration Testing & FDS
The control metrics for a highly accelerated life testing (HALT) vibration step-stress test are the setpoint gRMS level and the hold duration at that level. The system controls the gRMS at a single point and holds it until a set time or product failure, whichever the engineer decides.
The gRMS measures the test spectrum’s overall random vibration acceleration. Generally, it is an accepted metric for average test intensity. However, as we will discuss, the simplified nature of the gRMS can raise questions during testing.
Calculating gRMS from a PSD
The gRMS is an acceleration root-mean-square calculated from a power spectral density (PSD). The PSD is a statistical estimation of a signal’s distribution of power. It is not cumulative; it averages test data over a relatively short time compared to the overall duration, offering information on a section of the total test time.
An electrodynamic (ED) shaker provides a stationary, random spectrum with a near-constant PSD. As such, the PSD is a fair representation of the entire test’s distribution of power, and engineers can use it as a metric for comparison (so long as the PSDs use the same parameters). A HALT table’s excitation spectrum is not nearly as uniform.
HALT Excitations
HALT excitations vary depending on the product’s position on the table, the repetitive shock (RS) hammer configuration, the repetition rate, and system resonances. If an engineer mounts multiples of a product on the same HALT table or tests them on different machines, they may witness a variation in the products’ time to failure.
Amplitude Changes
HALT tables are essentially resonance machines; they drive energy into a resonant table. The RS hammers operate at frequencies that correlate to their speed and intensity of impact. If the engineer adjusts the intensity, the impact may not excite the table’s resonances.
The hammer’s driving frequency and harmonics affect frequencies below 1kHz the most. Tables can show large holes in the spectrum where the lower frequency bands are not excited. Higher frequencies (5kHz to 10kHz) are uniform in their excitation because the harmonic excitation is smeared in the higher frequencies.
Mass on the Table
Changing the mass on the table by adding or removing product will also change the table’s response. As the mass increases, the table’s resonant frequencies shift downward, leading to different product responses depending on the test setup.
Location on the Table
The distribution of potential damage across the surface of the HALT vibration table is not uniform. The RS hammers excite the table’s resonances, but the mounting points can have significantly different excitation characteristics.
The excitation of the table’s vibration spectrum depends on the closeness of a hammer strike point to a sensor. If a sensor is directly above a hammer, the spectrum will include peaks with strong harmonics. If a sensor is further from a hammer, the spectrum will be more broadband. This difference results in inconsistent failures and times to failure when the engineer tests multiple products on a table simultaneously.
Therefore, different locations on a table have different energy levels. Depending on location, samples could experience significantly different excitation environments.
Figure 1 shows a worst-case scenario, comparing the edge corner of a HALT table to the center. The potential damage is exaggerated at frequencies close to the hammer hit speed (about 32Hz).
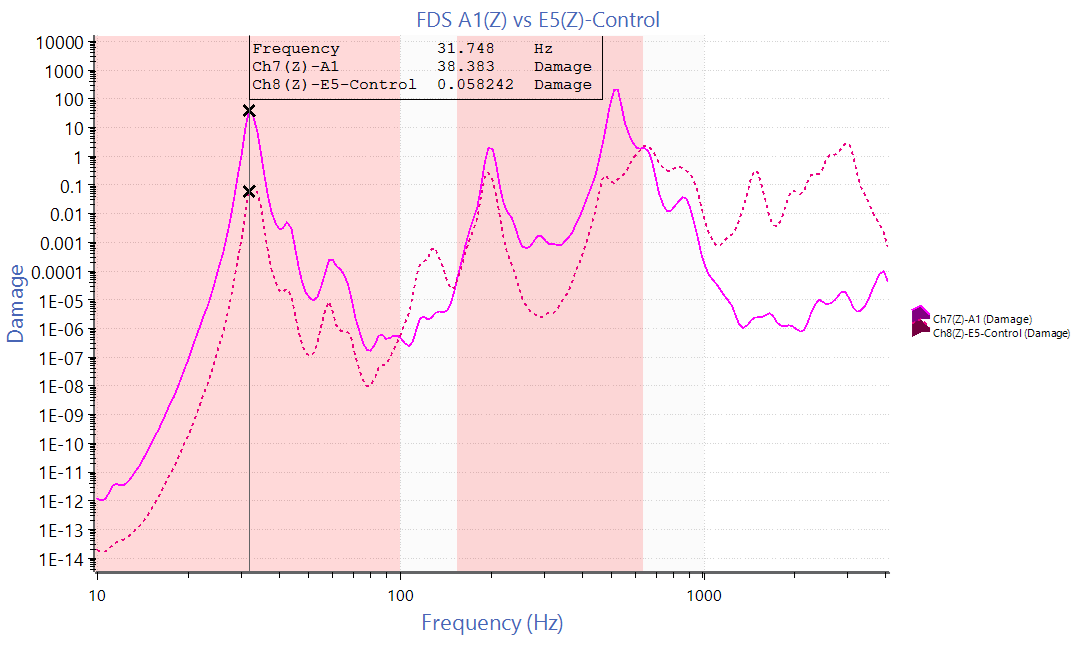
Figure 1. A comparison of damage potential: the center of a HALT table (E5) versus an outer edge (A1).
gRMS as a HALT Metric
The gRMS is a broad-spectrum intensity measurement, providing a snapshot of the test spectrum at a specified time without the frequency content. It does not account for the spectrum’s frequency or amplitude distribution or differences in peak acceleration and kurtosis.
For example, if we look at the PSD for the data in Figure 1, it also shows that the corner experiences more energy at 32Hz (Figure 2). However, the gRMS at the corner is 17.6 versus the center’s 38.7gRMS. An engineer might conclude that there is less damage at the corners. However, if product resonance is present around these lower frequencies with more fatigue damage, the corner will be more damaging, not less.
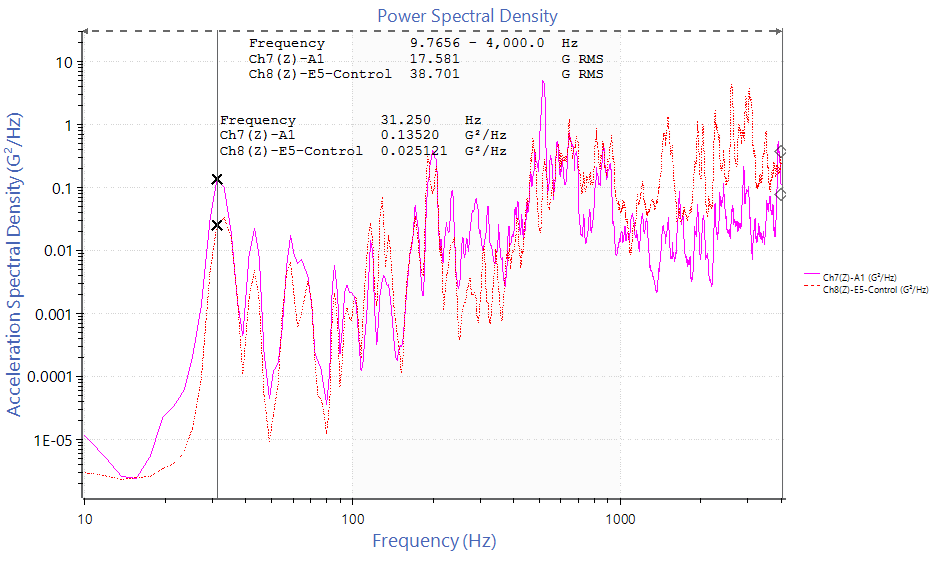
Figure 2. A comparison of average test intensity: the center of a HALT table (E5) versus an outer edge (A1).
Typically, engineers running an ED test use the gRMS to validate that the system has input the correct energy levels into the random test, but only after defining the spectral shape via the breakpoint table. The gRMS does not quantify spectral shape, which can shift in HALT due to amplitude changes, mass loading, and measurement location. As such, HALT vibration tests run at the same level can yield different results. For example, engineers can run a test specification of 10gRMS for 1 hour in several ways that result in varied product responses.
Consequently, the gRMS is oversimplified for HALT vibration testing. Engineers have to justify decisions with a general understanding of the table’s excitations, which are neither stationary nor Gaussian. As such, they may run into questions when evaluating their results.
- What vibration environment is the product exposed to?
- Why is there variability in failure time for multiple samples?
- How long should the product survive?
- How does a failure correlate to the real world?
- Should the product survive HALT or the end-use environment?
Proposed Metric
The metrics of gRMS and time do not provide engineers with enough information to understand:
- The test environment
- The relationship between the test and the real world
- The relationship between two of the same products tested on a different table or table location at the same levels
Vibration test engineers often use the gRMS, but it must be accompanied by additional information to be valuable. In the next lesson, we propose a cumulative metric for HALT: the fatigue damage spectrum.