FDS as a HALT Metric
August 21, 2023
HALT Vibration Testing
Back to: HALT Vibration Testing & FDS
So far, we’ve discussed the limitations of using the gRMS as the sole metric for highly accelerated stress testing (HALT) vibration step-stress tests. The following aspects of HALT machines indicate a need for a more suitable vibration testing metric:
- HALT tables have a non-uniform energy distribution.
- HALT excitations are more like harmonic excitations than stationary random vibrations. These excitations result in large valleys or holes in the frequency spectrum—particularly at lower frequencies—that relate to the fundamental frequencies of the HALT table and the repetitive shock excitation.
- As a test level metric, gRMS does not describe the spectral shape.
- Each HALT table, whether from the same manufacturer or not, has a unique spectral signature.
Fatigue Damage Spectrum
Vibration Research suggests the fatigue damage spectrum (FDS) as an alternative metric to gRMS for HALT vibration. The FDS accumulates over a test’s duration and represents the entire sequence of events. The power spectral density (PSD) from which the gRMS is calculated averages over a section of the total test time and does not account for all peak-to-valley cycles.
The FDS analyzes raw time data, accounts for every peak-to-valley stress cycle at each frequency bin, then calculates the cumulative damage number for each frequency bin. Engineers can use this information to make accurate damage assumptions about each frequency bin, generate an FDS, and compare fatigue levels between step-stress levels, test runs, machines, positions on the vibration test table, etc.
FDS Example
The graph traces in Figure 3 were created using a user-defined math equation to combine multiple channels and set the number of passes equivalent to a desired time duration. Data from 1-hour step-stress levels at 6gRMS, 12gRMS, and 20gRMS were enveloped, and data from 3-hour step-stress levels at 20gRMS were enveloped.
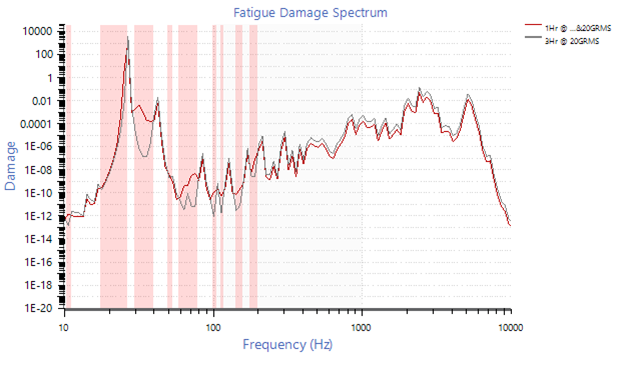
Figure 3. Enveloped data from HALT vibration step stress tests at 6gRMS, 12gRMS, and 20gRMS.
The two FDS traces were compared to determine how the lower amplitudes affected the overall damage imparted onto the product. The highlighted frequency bands indicate where the 1-hour test exceeds the 3-hour test. If the product has a higher resonant frequency in the 6-12-20gRMS trace, then there could be failures during the stepped stress test not generated by the 20gRMS test alone.
In this example, the 20-100Hz range was of interest. The difference in levels was primarily due to changes in the fundamental frequencies excited by the HALT machine when the amplitude changed. HALT tables do not respond uniformly to this change, and the excited fundamental frequencies shift so that some frequencies do not excite at certain amplitudes.
Calculating the FDS
Vibration test engineers use the FDS for accelerated test development. It combines multiple time-history recordings and weighs them based on their contribution to the life of the product in a standard environment. The resulting test is the damage equivalent to the product’s lifespan.
The following lesson describes the FDS calculation: What is the Fatigue Damage Spectrum (FDS)?
FDS as a HALT Metric
The accumulated FDS of multiple step stresses to failure provides the total damage accumulated to achieve the failure mode. This overall fatigue damage can function as a demand line for future product revisions to determine if product changes were successful. If the engineer mounts a product at different locations on a table or uses different tables, the time to failure may differ, but the accumulated fatigue will remain a valid comparison.
The FDS can also help set product metrics. Working in the damage domain reduces the effects of variables such as mounting location, shifting excitation frequencies, and HALT test machine idiosyncrasies. Engineers can confidently compare design turns, process changes, and cost-reduction efforts during the early phases of the product development cycle.
The next lesson provides several examples of FDS as a HALT metric.