HALT Vibration Tests & FDS: Example Uses
August 21, 2023
HALT Vibration Testing
Back to: HALT Vibration Testing & FDS
Vibration Research recommends using the fatigue damage spectrum (FDS) as a metric for HALT vibration step-stress tests. The following examples are a handful of many ways this metric can assist engineers with comparison and validation.
Verify Calibration
This example compares two HALT machines from different manufacturers with differing constructions. As a note, the calibrations for both are not ideal, but the comparison still stands.
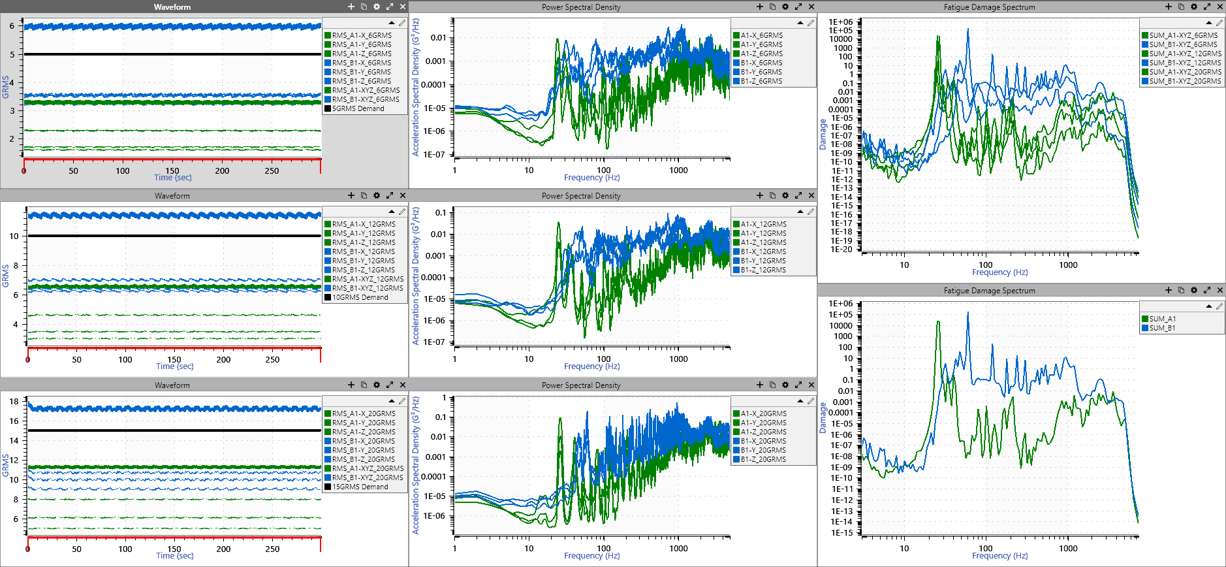
The test demand was 6, 12, and 20gRMS.
The individual x, y, and z control traces did not match the demand, so we calculated the vector RMS for the x, y, and z of both machines. These values were low aside from the B machine at 6gRMS.
The two FDS graphs on the right-hand side show the differences in the excited frequency range. The upper FDS is the XYZ-combined FDS for each step stress (6, 12, and 20gRMS). The lower FDS is the sum of each step stress. Clearly, machine B was significantly more damaging than machine A across nearly the entire excitation frequency range (from 30Hz up to 7,500Hz).
This comparison is relatively simple but highlights one of the common questions engineers have during HALT: why did my product fail on machine B but not on machine A? The operator would be limited to the information provided by the HALT controller. Both machines ran at 6, 12 and 20gRMS for the specified time, yet the parts continually failed on one machine but not the other.
While extreme, this example shows the value of understanding the spectral shape of the energy that the HALT machine generated. If an engineer had a product with a resonance at 25Hz, they would expect the failure to occur much faster on machine A than machine B. Any other frequency would be the opposite.
Variation by Location and Effect of Combining Step Stresses
This example shows six step stresses on a HALT machine with a better calibration state than the previous example. The step stresses ran at 5, 10, 15, 20, 30, and 40gRMS. The control point was at the center of the table, and we mounted tri-axial accelerometers at the center, edge, and corner of the table.
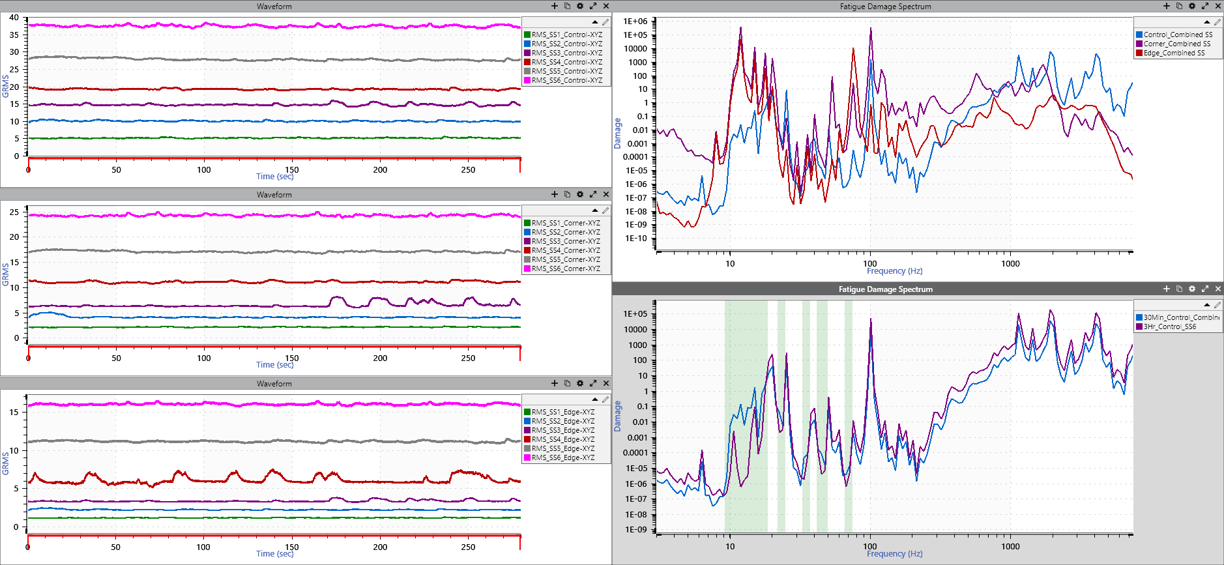
At the different locations (center, corner, and edge), there were extreme differences in amplitude at each step stress level. The control at the center was close to the demand RMS levels, but the corner and edge locations were significantly lower in amplitude.
The two FDS graphs on the right-hand side offer two scenarios.
The upper graph shows the accumulated fatigue for each step stress at the three locations. If an engineer were to mount the products at different locations, they would experience different fatigue damage levels.
On the lower graph, the blue trace represents the accumulated FDS after 30 minutes at each step stress for 3 hours. The purple trace shows the accumulated fatigue for 3 hours at 40gRMS. This comparison shows the difference in damage imparted on the product by progressing through the step stresses rather than dwelling at the highest step stress for the same duration. The green highlights in the background indicate the areas where the step stress process imparts more damage than a dwell at 40gRMS for the same duration. If a product’s resonances were within those green areas, the step stress method could generate failures that the 40gRMS level alone would not.
Calculate a Demand for A/B Comparisons or HASS
Calculating a demand is valuable in many applications. For example, an engineer could generate an FDS demand to compare product revisions or for screening.

In the R&D product design stage of development, engineers test an initial design. The product fails, and they make changes to generate a new design. Then, they put the new design back on the HALT machine and run a test until failure.
An FDS graph can determine the relative change in fatigue accrued by the new product. If the engineer is running the test to failure, they now know the time required to generate the failure and how much additional relative damage the new design can withstand.
Another application is defining a percentage of HALT for highly accelerated stress screening (HASS). Engineers can accumulate HALT levels, generate a combined FDS, then scale it down to a defined percentage (10% in this case). They can use this new level as the demand for HASS. To pass HASS, the accumulated fatigue must exceed these levels, showing that the test has met or exceeded the desired 10% of life.
This application is primarily for comparative purposes, such as comparing design revisions, determining HALT levels, or comparing machines.
Compare HALT to Test Specifications
This example displays several runs of various test specifications and the FDS for each. It helps answer the question: am I designing my products to survive a HALT or to validate that they will meet the test specifications as a part of certification?
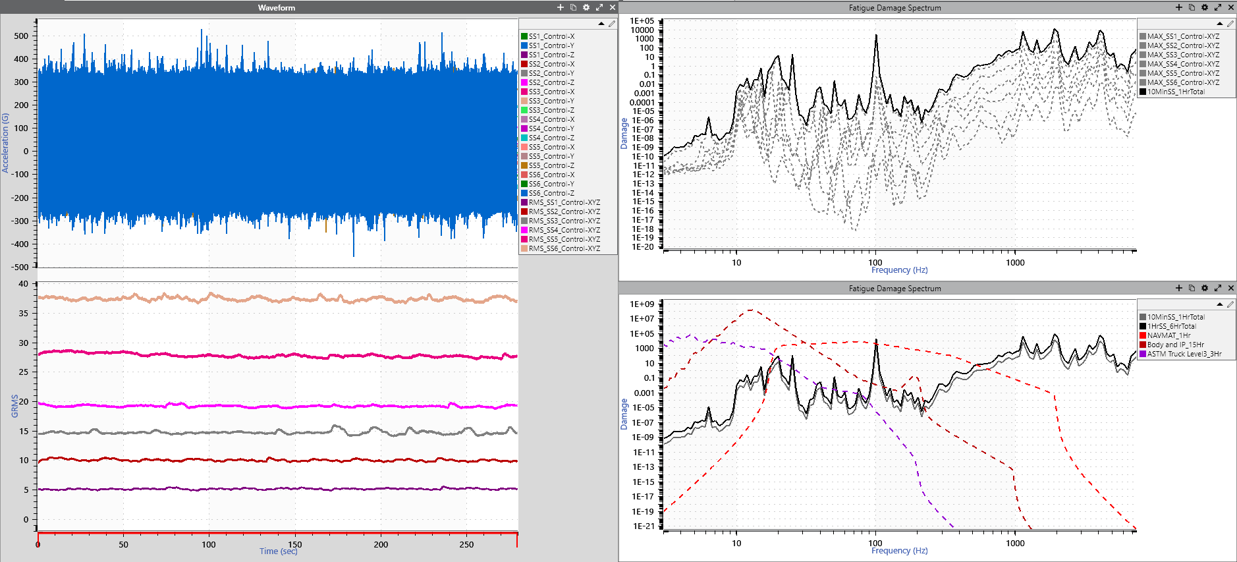
We can compare the FDS of the test specifications to the FDS of the HALT tests. This comparison shows the difference in the excited frequency ranges.
The upper FDS graph shows the accumulated FDS for 10-minute step stresses at 6 step stresses. We can compare it to the test specifications’ FDS levels. We also scaled the FDS to show the difference between 10-minute and 1-hour step stresses.
Compare HALT to Field Data
This comparison is like the previous one but compares HALT data to field data. It is automotive data scaled to 10,000 hours (1 lifetime). If the product failed at this point, the engineer would be concerned about whether the automobile would survive the end-use environment.

Conclusion
The FDS accounts for potential damage across a wide frequency range. This approach ensures that a minimum level of fatigue is introduced into the product regardless of the HALT machine or a change in the HALT vibration table’s characteristics. The FDS applies equally well to HASS as it does to HALT. It allows engineers to effectively compare the different scenarios in HALT, such as changing mounting positions, orientation, or machines. It also allows for comparison to real-world environments and comparison of multiple product iterations to validate design change.