Frequency Resolution
March 29, 2018
Getting Started
Power Spectral Density
Converting Recorded Data
Statistics & Probabilities
Test Control
Back to: Random Testing
The power spectral density’s (PSD) basic frequency resolution is the frequency spacing of the fast Fourier transform (FFT), Δf = 1 / T, where T is the length of the time sample. However, it is important to understand how window functions change the effective frequency resolution, and how the frequency resolution affects the evaluation of resonance peaks.
The Windowing lesson shows that sideband leakage occurs when a window function is applied to the digitized signal. Applying a window before computing the FFT reduces the remote band noise generated by non-periodic components in the signal. The trade-off is that it increases the effective width of each FFT frequency band. The windowing process slightly distorts the signal and reduces the precision of the FFT’s frequency resolution.
Figure 2.22 compares the PSD of a periodic signal with and without windowing (from Figures 2.19 and 2.21). A signal without a window is sometimes called a “rectangular window.”
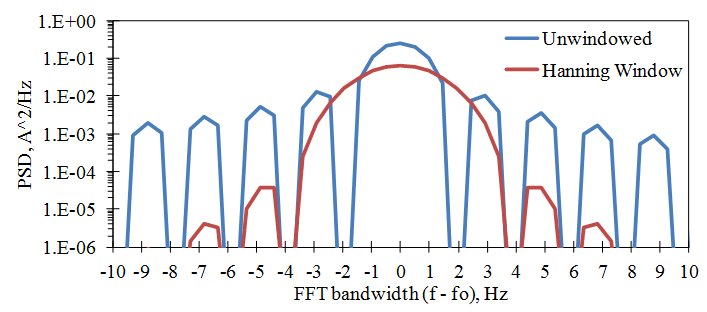
Figure 2.22. Comparison of the FFT bandwidth with and without windowing. (Base FFT using SR = 2000 Hz, N = 1024, Δf = 1.953 Hz.)
The comparison has 4 times the frequency resolution of the base FFT and plots the frequency axis relative to the sine wave’s frequency, fo.
The unwindowed frequency resolution is about ± Δf /2, ignoring the remote band leakage. With the Hanning window, the frequency resolution spreads out to about ± 3 Δf /2. This comparison signifies that pure tones can only be resolved to accuracy within a range of three times the base FFT resolution.
Equivalent Noise Bandwidth
The equivalent noise bandwidth measures a frequency band’s relative mean square amplitude when the signal is white noise. This measurement is determined by the half-power bandwidth, which is based on the frequencies where the band level is half of the peak. For the Hanning window, this value is 1.5 Δf.
The PSD’s frequency resolution also affects the relative amplitude of broadband noise and its resonance peaks. In Figure 2.23, a broadband noise signal is mixed with a resonance response signal. The PSD magnitude is normalized to a 1Hz FFT bandwidth no matter the actual FFT bandwidth. This process results in a stable magnitude for a broadband signal that is independent of the FFT bandwidth, Δf.
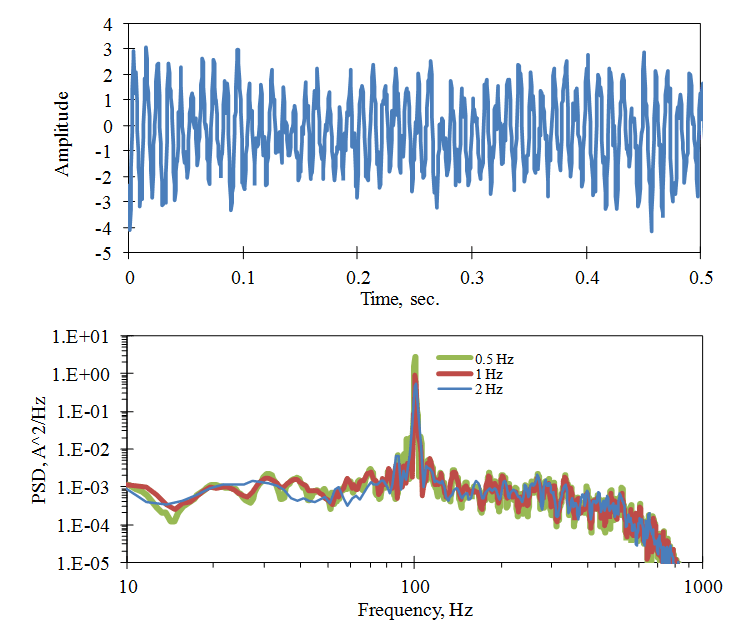
Figure 2.23. The PSD of a resonance response with random noise and computed with different FFT bandwidths: 0.5Hz, 1.0Hz, and 2.0Hz.
However, for a sharp resonance peak or a sine wave, the FFT level is independent of Δf when Δf is larger than the bandwidth of the peak. Therefore, the PSD level varies inversely with Δf. The mean square and RMS levels of the peak response can still be recovered by summing the mean square values in the frequency bands around the peak (Equation 4).