Averaging
March 29, 2018
Getting Started
Power Spectral Density
Converting Recorded Data
Statistics & Probabilities
Test Control
Back to: Random Testing
For a random vibration signal, the digitized time sample used to calculate the FFT gives just one estimate of the PSD. One time sample does not provide an accurate determination of the PSD’s magnitude. In fact, the statistical error in the PSD magnitude from one sample of white noise is 100%, in that the standard deviation equals the mean value.
In Figure 2.24, the PSD is computed using one sample of a white noise signal, and a low pass filter is applied at 1,000Hz. The plot’s axes are linear. The RMS value of the signal is 1.0, so the PSD should have a magnitude of 0.001 from 0 to 1,000Hz. In this example, the mean value of the PSD equals 0.00093, and the standard deviation equals 0.0010.
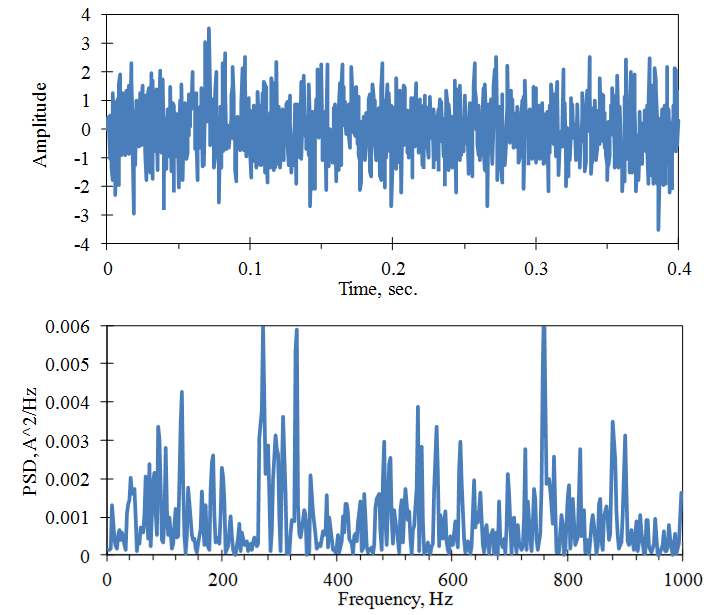
Figure 2.24. PSD computed from one sample of a white noise signal.
Averaging PSDs
The accuracy of the PSD can be improved by averaging PSDs from successive samples of a signal. The standard deviation of a random variable’s M average decreases with the square root of M. In Figure 2.25, the PSD is computed from 25 and 100 averages of the signal in Figure 2.24. The PSD’s standard deviation reduces, approximately, by factors of 5 and 10, respectively.
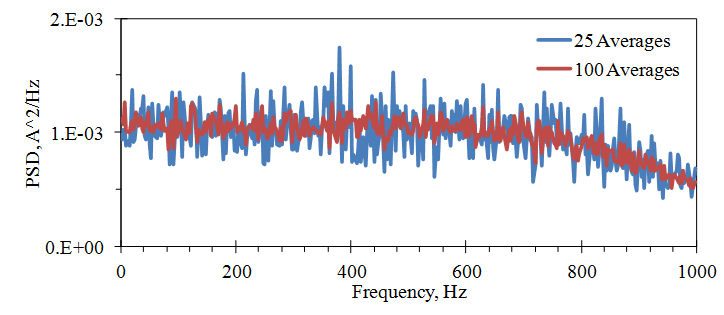
Figure 2.25. PSD computed from the averages of a white noise signal. 25 Averages: Mean Value of PSD = 0.00097, Standard Deviation = 0.00020. 100 Averages: Mean Value of PSD = 0.00098, Standard Deviation = 0.00011.
When a window like the Hanning is applied to a signal, a part of the information from the beginning and end of the digital sample is lost. Therefore, it is common to compute averages using overlapping samples. Figure 2.26 illustrates a 50% overlap.
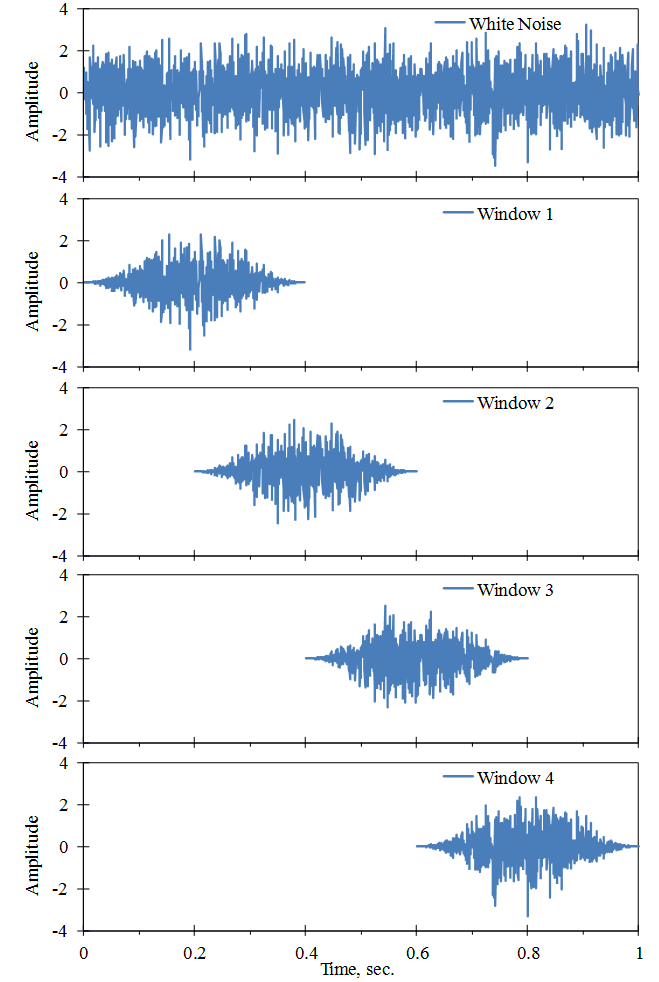
Figure 2.26. Successive digital samples of a signal using a Hanning window with 50% overlap.