FDS Validation and Result Comparison
February 23, 2021
Analyzing Waveforms
Reproducing Waveforms
Fatigue Damage Spectrum (FDS)
Sine-on-Random (SoR) Test Generation
Shock Response Spectrum (SRS)
Back to: Test Development with Recorded Data
Engineers can use the fatigue damage spectrum (FDS) to generate an accelerated random PSD test profile, but it is also useful for comparing test failures, comparing test specifications to real-world data, and determining if a product is under-tested or over-tested.
FDS Comparison
As discussed in “Comparing Tests: Industry Standards vs Real-world Data,” industry standards may not be updated for years after they are created. If a test engineer is interested in comparing a test standard to current data, they can do so with the FDS.
As the FDS is reflective of real measured data, an FDS-correlated test profile can be used for accurate comparison. By confirming the validity of an industry standard, the test engineer can be more confident in their test results.
A comparison of the standard FDS and field recorded FDS can help a test engineer determine if the full spectrum is valid/invalid or if there are isolated areas of under-testing or over-testing. For additional analysis, they can generate an FDS-correlated PSD profile using Henderson-Piersol’s potential damage spectrum.1 The test profile must have the same time frame as the standard FDS for a valid analysis. From there, the FDS-correlated test profile and standard profile can be compared.
It is important to mention that the validity of the comparison is dependent upon the product under test and the end-use environment.
Industry Standard Case Study
Vibration Research conducted a case study to compare industry standards and real-world data. An FDS was developed using recorded time history files acquired from a commercially shipped package. Then, a PSD test profile was created with the FDS to replicate a lifetime of damage. The FDS and test profile were compared with similar files generated from the ISTA 3 industry standard test specification.
Overview
The team packaged an ObserVR1000 and multiple external batteries into a common cardboard shipping box. A triaxial accelerometer was attached to ObserVR1000’s top surface and another to the inside of the box. The vibration was recorded as the package was shipped via FedEx.
Two shipments were used in the study. The first shipment traveled from Grand Rapids International Airport (GRR) to Vibration Research headquarters in Jenison, Michigan. The second traveled from Vibration Research to the nearest FedEx facility and back. The recordings were ended when the boxes returned.
Results
A road travel segment was identified for both recordings. The data from these segments were used for calculation, comparison, and analysis.2
The test profile generated from the recorded data had a broad similarity to the standard test profile but with more variation, which reflects the random nature of real-world events. It is also possible to see the same general areas of relative under- and over-testing in the FDS comparison.
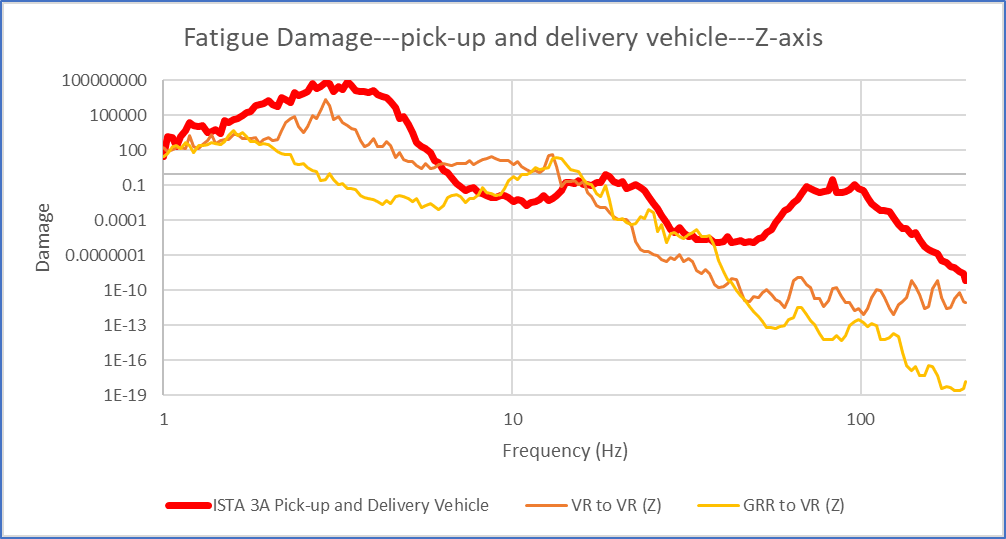
Comparison of the FDS for recorded data and test standards.
While this case study was not a comprehensive study of packaging behavior, it demonstrates that important insights can be gained through the comparison of an FDS from real-world data and a test standard.
Test Acceleration with Sine and Random Vibration
The FDS is based on the response of single-degree-of-freedom systems. Altogether, the FDS is a reliable method for generating a random test reflective of the real world, which is often non-Gaussian and non-stationary.
However, there are vibration environments with non-random vibration—e.g., repetitive and predictable. Dominant sinusoidal components must be considered when generating an accelerated test profile. In such instances, the FDS would not be the ideal test generation option. Rather, a sine-on-random test is preferrable.
In the next section, we will discuss a Sine-on-Random test generation method developed specifically for environments with dominant sine and random background vibration.