Experimental Approaches to Structural Resonance Testing
June 7, 2023
Basics
Design Stage
Addressing Resonance
Back to: Resonance in Product Development
At the design stage of product development, engineers identify resonant frequencies by running an experimental approach or performing an analysis, such as finite element analysis, and confirming it with measured data. Experiments excite the physical item with known inputs and record the responses for subsequent analysis.
This lesson discusses several methods of experimental resonance identification testing.
Sine Testing to Identify Resonance
A primary application of sine vibration testing is identifying resonances. Sine testing runs pure sine tones of constant amplitude on a shaker table.
Sine Sweep
More often than a single sine tone, engineers run sine sweep tests to identify resonant frequencies. During a sine sweep, the vibration shaker “sweeps” through the frequency range of interest with a constant amplitude and set rate of increase.
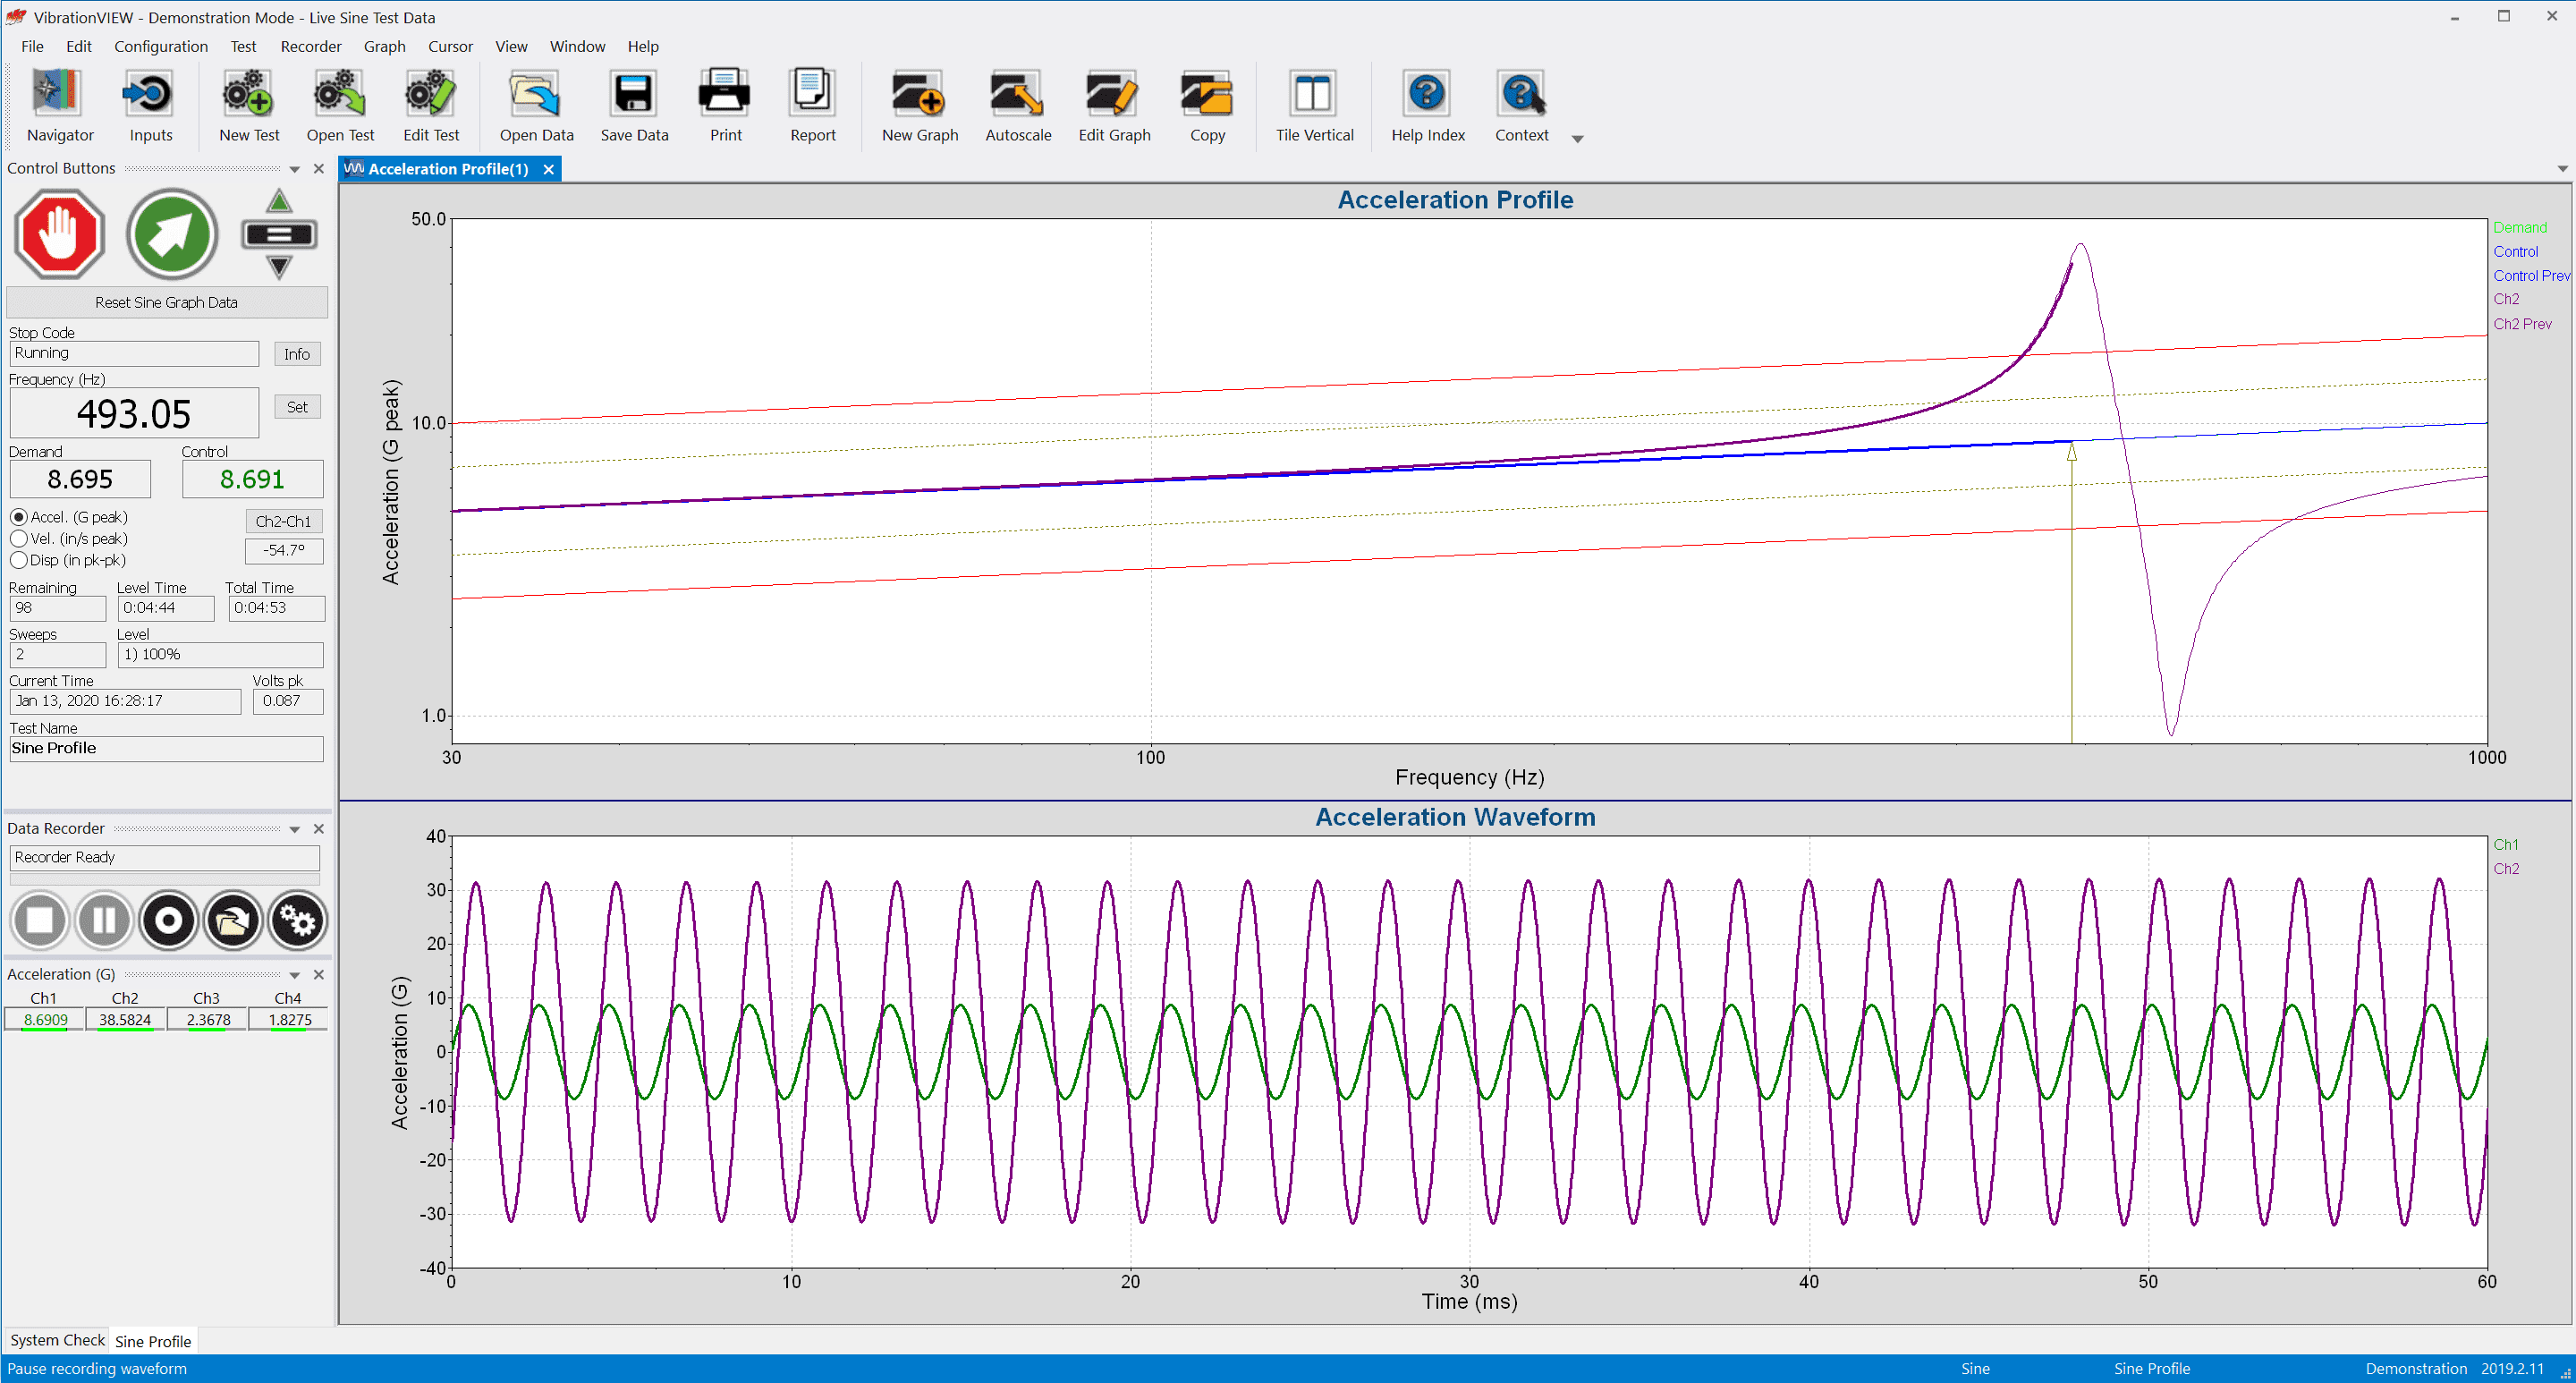
Sine sweep test in VibrationVIEW.
For example, a 1G sine sweep from 10 to 2,000Hz at the rate of one octave per minute is a recurrent specification and takes less than ten minutes to complete. A sine sweep allows the engineer to observe a product’s response in the frequency range of the operational environment. It is an effective way to find vulnerabilities and confirm results from virtual models.
Learn more about running a sine sweep test in the Sine Testing course.
Sine Resonance Track and Dwell (SRTD)
A product accumulates fatigue damage most rapidly when subjected to inputs that excite its resonant frequencies. An engineer can design a sine test to dwell at the first significant resonance until 1) failure occurs or 2) sufficient time passes to confirm that the test item will not fail in operation.
During an SRTD test, the control dwells the shaker frequency on a resonance until the product fails. A pre-established threshold of time or number of cycles to failure determines if the test is successful.
Resonant Frequency Shift
Resonant frequencies shift as a product’s material fatigues. For an SRTD test to be valid, the dwell frequency needs to shift with the resonance. When running an SRTD test, engineers should note the potential change in a resonance’s frequency and phase and adjust the test accordingly.
Vibration Research’s controllers can automatically track resonant frequencies so the output remains on the resonance even if fatigue damage shifts the resonant frequency. VibrationVIEW has advanced phase tracking controls that allow the user to dial in on resonances and maintain peak amplitude via phase versus transmissibility.
Sine Testing Caveat
It is well-known in the vibration testing industry that sine testing is not wholly representative of most products’ real-world vibration. Sine testing accounts for some rotational excitations, such as gear meshing and periodic excitations from engine cylinders firing. However, there are often contributing random components that underly the pure sine tones.
Often, developing a realistic random vibration test is critical to improving product designs. Sine testing excites one resonance at a time and cannot test for the interaction between multiple resonances. A random test excites an entire frequency range simultaneously, revealing resonance interactions.
If both the sine and random components contribute to product fatigue, an engineer may consider a sine-on-random (SoR) mixed-mode test. Which test type an engineer uses depends on the product and necessary qualifications.
Learn More
Sine Data Reduction
For oversized or complex test articles, such as satellites, a single-axis sine sweep may not be comprehensive enough. The engineers may require more data or want to monitor behavior on the shaker table more closely. In this case, a specialty testing process called sine reduction may be fitting.
Engineers use sine reduction to identify resonance and monitor safety on large structures. A sine reduction setup syncs a reference I/O unit to the shaker control system to expand the system’s channel count. The main controller runs a sine sweep test, typically with tracking filters to reduce noise or harmonics. The controller’s COLA signal (“sine tracking signal”) tracks the drive frequency and calculates the amplitude and phase at the frequency value. The reference I/O unit runs the same sine sweep using the COLA signal as the frequency reference, applying the same tracking filters.
Accurate frequency tracking ensures the identification of resonant frequencies for product development and qualification.
Modal Testing to Identify Resonance
Complex structures have multiple resonant frequencies that are intensified or suppressed when they interact. When engineers do not account for them, it leads to structural fatigue or damage. Modal testing records a test item’s response to derive information about its structural dynamics.
Modal Basics
When a structure is excited at its natural frequency, its vibration causes the structure to respond by deforming into different dynamic shapes as a function of frequency input (Figure 2). These “mode” shapes help describe the structure’s vibrational characteristics. Engineers derive the mode shapes and corresponding parameters from the structure’s frequency response.
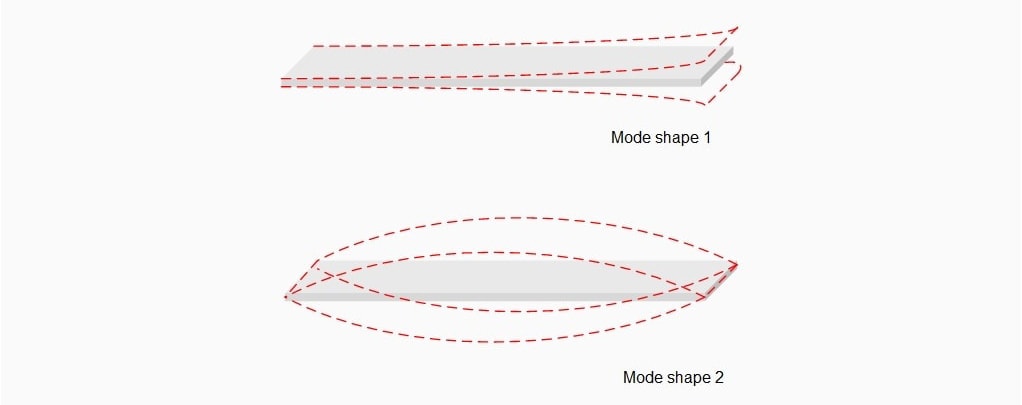
Figure 2. Example of the first two mode shapes for a basic structure.
MDOF Systems
Most complex structures are multiple degrees of freedom (MDOF) systems. They generate a combination of responses and have multiple natural frequencies that may interact. Generally, modal analysis can be simplified by separating the structure into multiple constituent single-degree-of-freedom (SDOF) substructures.
Software programs can predict mode shapes, peak deflections, and corresponding parameters of SDOF substructures from the structure’s response. The derived information helps engineers to determine the natural vibration frequencies and validate their design.
Experimental Modal Testing Overview
To perform an experimental modal test, an engineer excites the structure at rest (i.e., not running) with a mechanical device and a data acquisition system records the input and response. An impact hammer is the standard tool for excitation.
Modal testing is more sophisticated than a simple “bump” test because the impact hammer records the input force, and a sensor records the output response. As we will discuss in the next lesson, the analysis portion of modal testing uses the excitation and the output to identify mode shapes.
When Should I Use Modal Testing?
Engineers choose modal testing for complex structures such as space vehicles to qualify and validate the structural design. Sine testing identifies resonances but does not separate a response into individual components. Pre- or post-manufacturing, modal analysis can diagnose or prevent issues within the overall design.
Run Up/Coast Down to Identify Resonance
Rotational machinery typically varies in speed. Engineers record data over time to understand the potential vibrations of the rotating component. This process helps improve the safety of rotational equipment by analyzing its response to the range of RPMs that may occur in use.
Often, a rotating component does not pose an issue while running in a steady state, but when it is starting up or shutting down and its speed incrementally increases/decreases. The angular frequency may match a resonant frequency as the speed changes, prompting a shudder-like response from the system.
Engineers can run a ramp-up or coast-down to evaluate the effects of change in speed. A run-up/coast-down steadily increases the RPM as a sweep and is recorded with a tachometer or proximity sensor.
Analyzing the Data
Following experimental testing, engineers analyze the data to pinpoint the natural frequencies in a component or structure. From there, they can adjust their design to prevent damage (if necessary). The following lesson will discuss how to analyze test data to identify resonances.