Data Analysis for Identifying Resonances
June 8, 2023
Basics
Design Stage
Addressing Resonance
Back to: Resonance in Product Development
After performing experimental resonance testing, an engineer must analyze the data to identify a device under test’s (DUT) resonant frequencies. There are numerous ways to accomplish this objective, some of which are described below.
Amplitude Response
Data collected during a resonance search can be in the form of time vs. amplitude, frequency vs. amplitude, or frequency vs. the ratio of input excitation to output response. In the first case, the time domain data needs to be converted to some form of a frequency domain signal. Tools like the fast Fourier transform (FFT) can transform time domain data to the frequency domain.
Resonance on a Frequency Graph
On frequency plots, resonances appear as high peaks in a narrow frequency band. As other excitations also appear as peaks in the frequency domain, engineers collect both the excitation and response data because a DUT at resonance vibrates with more acceleration than the input vibration.
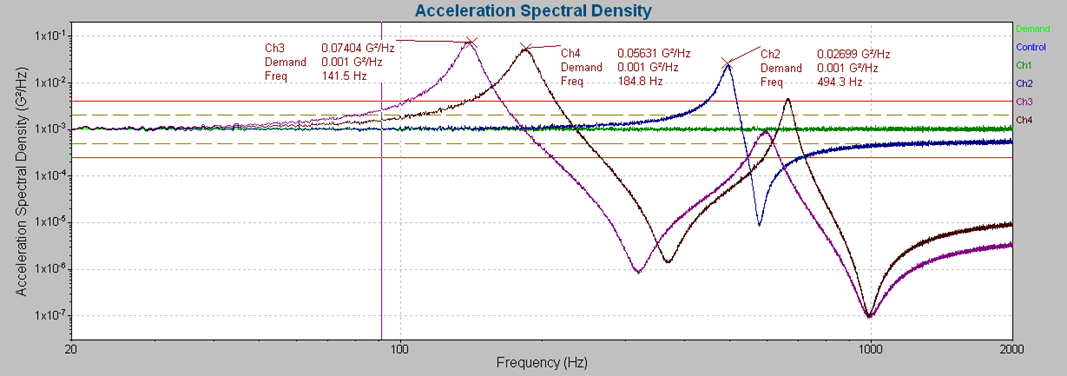
An acceleration spectral density graph with annotated resonances.
The Q-factor of a resonance defines its sharpness at the peak. It is the ratio of the resonance’s center frequency to its half-power bandwidth. The sharper the resonance, the quicker it will resonate during a sine sweep and the harder it will be to control. For an in-depth discussion on this topic, see the following webinar on sine resonance track & dwell (SRTD) testing.
The excitation frequency does not need to equal a resonant frequency to cause amplification. Even nearby frequencies (±10%) can agitate some amplification. Therefore, resonances can increase in amplitude before and after the resonance peak. A resonance peak can be sharp or broad, depending on the structure’s damping.
In addition to FFT-related plots, other information, such as transmissibility and phase, confirms resonances and defines the most damaging frequencies.
Transmissibility & Phase
A transmissibility graph displays the amplitude ratio between two channels—i.e., input vibration to output response as a function of frequency. When searching for resonances, the transmissibility plot indicates which frequencies generate an amplified response, indicating a resonance. A DUT’s maximum transmissibility occurs at its natural frequency with no damping.
At resonance, the excitation and response are, theoretically, 90 or 270 (-90) degrees out of phase. Realistically, the phase difference will typically be near to, but not exactly, ±90 degrees because of material imperfections, accelerometer mounting locations, and non-linear shaker motion. The phase difference may also shift due to changes in test amplitude or non-linear responses to fatigue.
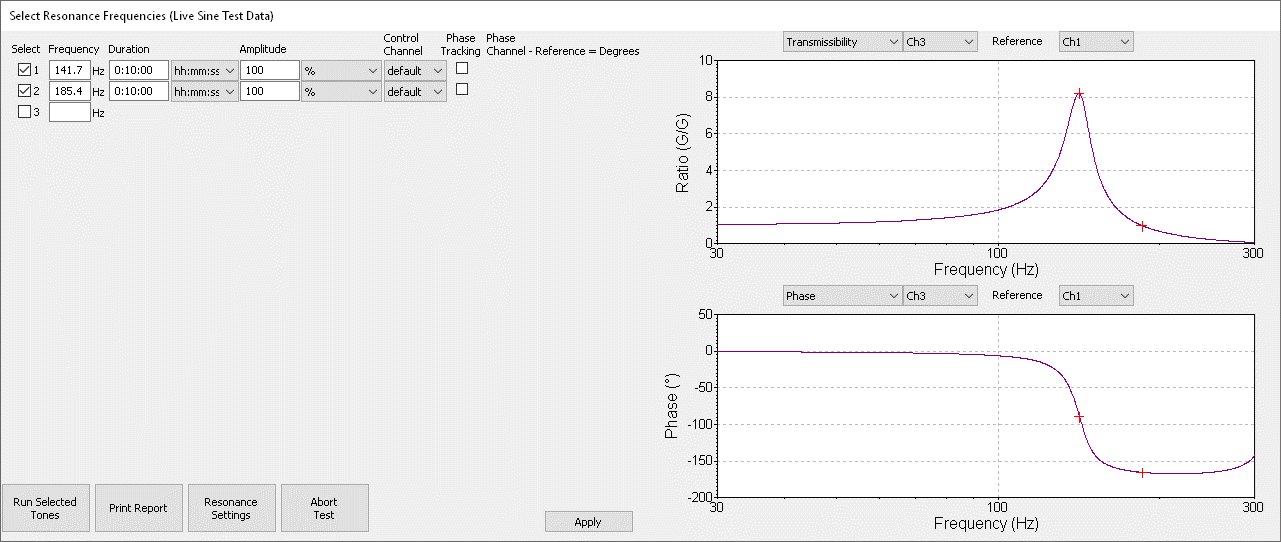
The Select Resonance Frequencies dialog in the VibrationVIEW software displays the transmissibility and phase information for a sine sweep.
Moving Forward
After identifying significant resonances, an engineer might adjust the DUT design so that damaging input frequencies are not close to resonant frequencies inherent to the product structure.
A general guideline when designing a product is to separate any driving forces arising from potential operating environments (rotations, firing frequencies, suspension inputs, etc.) from any natural frequencies inherent to the system design by a factor of two. This rule provides reasonable assurance with a sufficient margin that the system is less likely to encounter failures due to resonance.
Testing a product at the highest resonant frequencies can also be a productive way to fatigue the product quickly for qualification purposes. In this case, the engineer could use the peak transmissibility information and apply a sine dwell at selected frequencies.
Transfer Function
After experimental modal testing, the software calculates a transfer function in the frequency domain known as the frequency response function (FRF). Like transmissibility, the FRF indicates the DUT’s resonant frequencies and provides additional information about the system’s stiffness. The peak width is representative of the amount of damping, with a wider peak having relatively more damping. The dominant resonant frequencies manifest as unique mode shapes of the structure.
The software calculates the FRF from the excitation and corresponding response. For a linear and time-invariant system, it describes the ratio of the two signals over the defined frequency range. It differs from a transmissibility function because it provides phase information.
The following transfer function comes from the paper “How to Set Up FE Harmonic Modal Analysis to Match Experimental Data.”
A transfer function displaying a head expander’s frequency response with labeled resonance peaks.
Coherence
While a transfer function provides valuable information about the amplitude and phase relationships between the input excitation and output response, a coherence function provides insight into the correlation between the input and output signals in the frequency domain.
At each frequency, coherence is a value between 0 and 1. A value of 0 indicates that a response is unrelated to the input, and 1 indicates that it is perfectly correlated to the input. If a plot identifies a frequency as a resonance, and the frequency has coherence near 1, the engineer can be confident that the resonance is due to the input and not spurious noise from other sources.
The coherence of two signals depends on the phase difference between them. It is a normalized value, so it does not specify if the signals are in or out of phase. Instead, coherence indicates if the phase difference changes at the defined frequency. This information allows the engineer to evaluate the relative motion between signals.
Bode Plot
After performing a run-up or coast-down, the engineer can review the amplitude and phase data to identify resonance. If the vibration levels increase/decrease at a steady rate, then the angular frequency of the rotating component did not cross a resonant frequency. However, if the data has a peak amplitude and a phase shift at the same frequency, then resonance is likely.
A bode diagram displays the transfer function of a system’s frequency response as a magnitude and phase graph. These graphs are on a logarithmic scale, so they can indicate how the system responds over a wide range of frequencies. Bode plots indicate the stability of a system, and changes in the amplitude and phase help engineers identify resonance.