Diagnosing Resonance Post-production
June 8, 2023
Basics
Design Stage
Addressing Resonance
Back to: Resonance in Product Development
Typically, an engineering team will set criteria for acceptable resonant frequencies during the design stage of product development. Following a design failure mode and effect analysis (FMEA), the team can identify potential failures resulting from exposure to vibration.
A thorough vibration testing procedure that includes resonant searches and field-correlated vibration testing accounts for a lifetime of fatigue and ensures robustness against resonant-induced failures. Even with rigorous vibration testing, however, unforeseen resonances can appear post-production for many reasons, including:
- The supply chain made subtle material changes or modifications to a sub-component without adhering to contractual change management guidelines meant to safeguard against undetected potential failures.
- The team did not accurately account for the support structure, thereby affecting the overall stiffness or mass of the product and shifting a resonant frequency into an unacceptable range.
- The test standard did not adequately account for environmental factors, resonances, or extraordinary loads. Therefore, initial testing missed potential field failures.
In this instance, the engineering team must determine the cause of the system failure considering all components, their interactions, and the operational environment. They must identify the source of the vibration causing the resonance, which requires an understanding of the equipment, application, and system dynamics.
Signs of Resonance
Although all product designs differ, engineers have picked up on several indicators that point to resonance. The first telltale sign may seem obvious: resonance amplifies a component’s natural frequency, so amplitude peaks in the same direction as the excitation with seemingly no explanation may be resonance. This amplified vibration may be visible, but engineers require data for confirmation.
Noise is another indication. An increase in vibration amplitude also increases the resulting sound wave intensity.
Other signs of resonance may not be so evident. While failures due to resonance often include cracks in welds and fasteners, loose bolts, bearing wear, and support or foundational damage, they are not always an indication of resonance. This damage may be due to the increased vibration but does not necessarily mean the component is resonating. Resonance can also indirectly amplify already existing issues, such as a slightly unbalanced rotor.
Diagnosing Resonance
Engineers perform a series of experimental tests on the overall design to confirm that resonance—not an installation or maintenance issue—is the root cause of the damage or failure. If there is resonant activity, they must determine which component is resonating and which part or external factor is vibrating at the resonant frequency.
There are several considerations engineers can keep in mind when attempting to diagnose resonance as the cause of failure:
- Look to likely sources of resonance, such as shaft misalignment and rotor unbalance
- Compare the peak frequency to the operating speeds of reciprocating or rotating equipment
- Test the product over the full vibration spectrum, applying the equivalent to a lifetime of use
Resonance Examples
Several examples of failures due to resonance are well known, such as the Tacoma Narrow Bridge collapse (resonance due to wind), the United Airlines Flight 232 crash (resonance-induced fatigue of engine’s rotating components), and the Ford Pinto fuel tank defect (resonance excited by rear axle oscillation at certain fuel levels). The following are several examples of resonance identification that Vibration Research has encountered.
Industry-standard Vibration Tests for Bus Seats
![]()
Bus seat failures occasionally occur in the field, but industry-standard laboratory tests can fail to predict them. VR sought to collect and analyze field vibration data to understand the cause(s) behind seat failure.
At the time of the study, the industry-standard test method was a low-frequency 1gpk sine dwell for 10 million cycles. After reviewing the recorded field vibration, VR determined that the single-frequency sine dwell fell between the frequency ranges excited by the wheel speed and engine RPM. Most of the vibration energy did not occur at the standard test’s primary frequency, and extensive fatigue could accrue across a range of other frequencies. The current industry standard did not reflect real-world data.
Equipment Installation Training
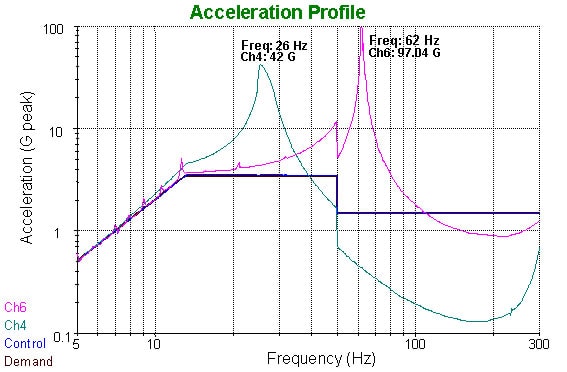
VR engineers ran a random and sine test on a slip plate to determine which test was more severe. Mounted to the slip plate were two aluminum masses attached by threaded rods of different lengths and thicknesses; the masses also had different resonant frequencies. The accelerometers mounted on the mass at the top of each rod were connected to Channels 4 and 6 on the controller.
As the engineers ran the random test, the Channels 4 and 6 accelerations were greater than the control point. The resonances at 27Hz and 62Hz amplified the vibration levels.
The control point of the random test had higher gpk levels than the sine test. However, the sine test had higher gpk levels at the resonances. Therefore, the sine test was the more severe test. The relative severity of sine and random tests will vary depending on the product’s resonant frequencies and Q factor.
Windshield Resonance
When practical, the analysis of recorded data is a helpful step before running a qualifying vibration test.
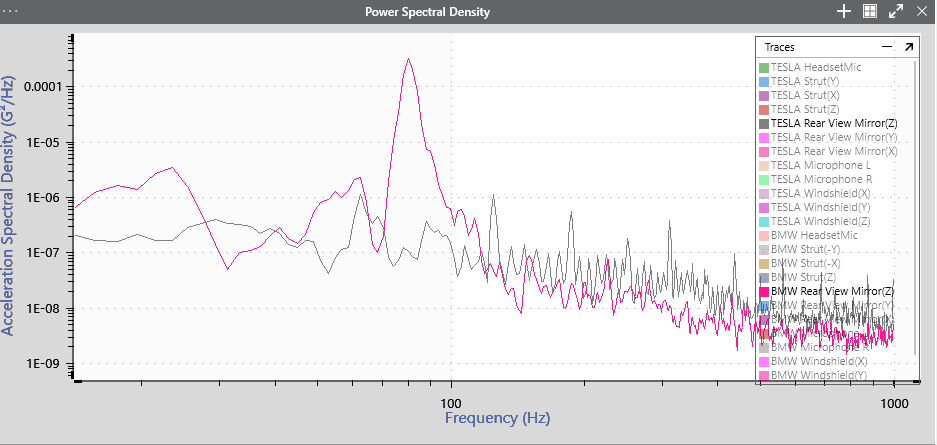
The team at Vibration Research mounted sensors to an electric vehicle and an internal combustion engine vehicle and drove them on the same route to gather acoustic and vibration data. The purpose was to gain a better understanding of the NVH differences between the vehicle types.
At startup, the ICE vehicle’s rear-view mirror displayed a steady peak at 60-70Hz. After analyzing the measured data, VR discovered that vibration tests of rear-view mirrors often detect resonance around this frequency.