View & Edit Data
March 31, 2021
Getting Started
Analysis Options
Recording & Analyzing Live Data
Back to: Getting Started with ObserVIEW
After importing a file or opening an ObserVIEW project, the user will be directed to the program’s main view.
Ribbon Menu
A ribbon menu is located at the top of the program, and the Home tab is the default. The subsequent tabs are Export, Editor, Replay, Graph, Cursors, Order Analysis, View, and Help.
Main Graph
The main graph appears at the center of the program. It displays the data as line “traces” and includes a legend, a graph title, and axes that correspond to the data. The graph properties are in the Properties pane to the right (by default). The user can modify the visibility of the graph traces in the Traces pane.
To add a new graph, select the Add Graph button in the main ribbon or the plus icon in the main graph. A blank graph will appear. To the right of the main graph, use the Traces pane to select which traces to add to the graph.
Summary Graph
Below the main graph window are the summary graph and playback options. As the name suggests, the summary graph displays a summary of the selected graph’s waveform data. The user can use the summary controls to play through the data recording.
Edit Data
The Editor tab in the main ribbon contains tools to cut, paste, and append files.
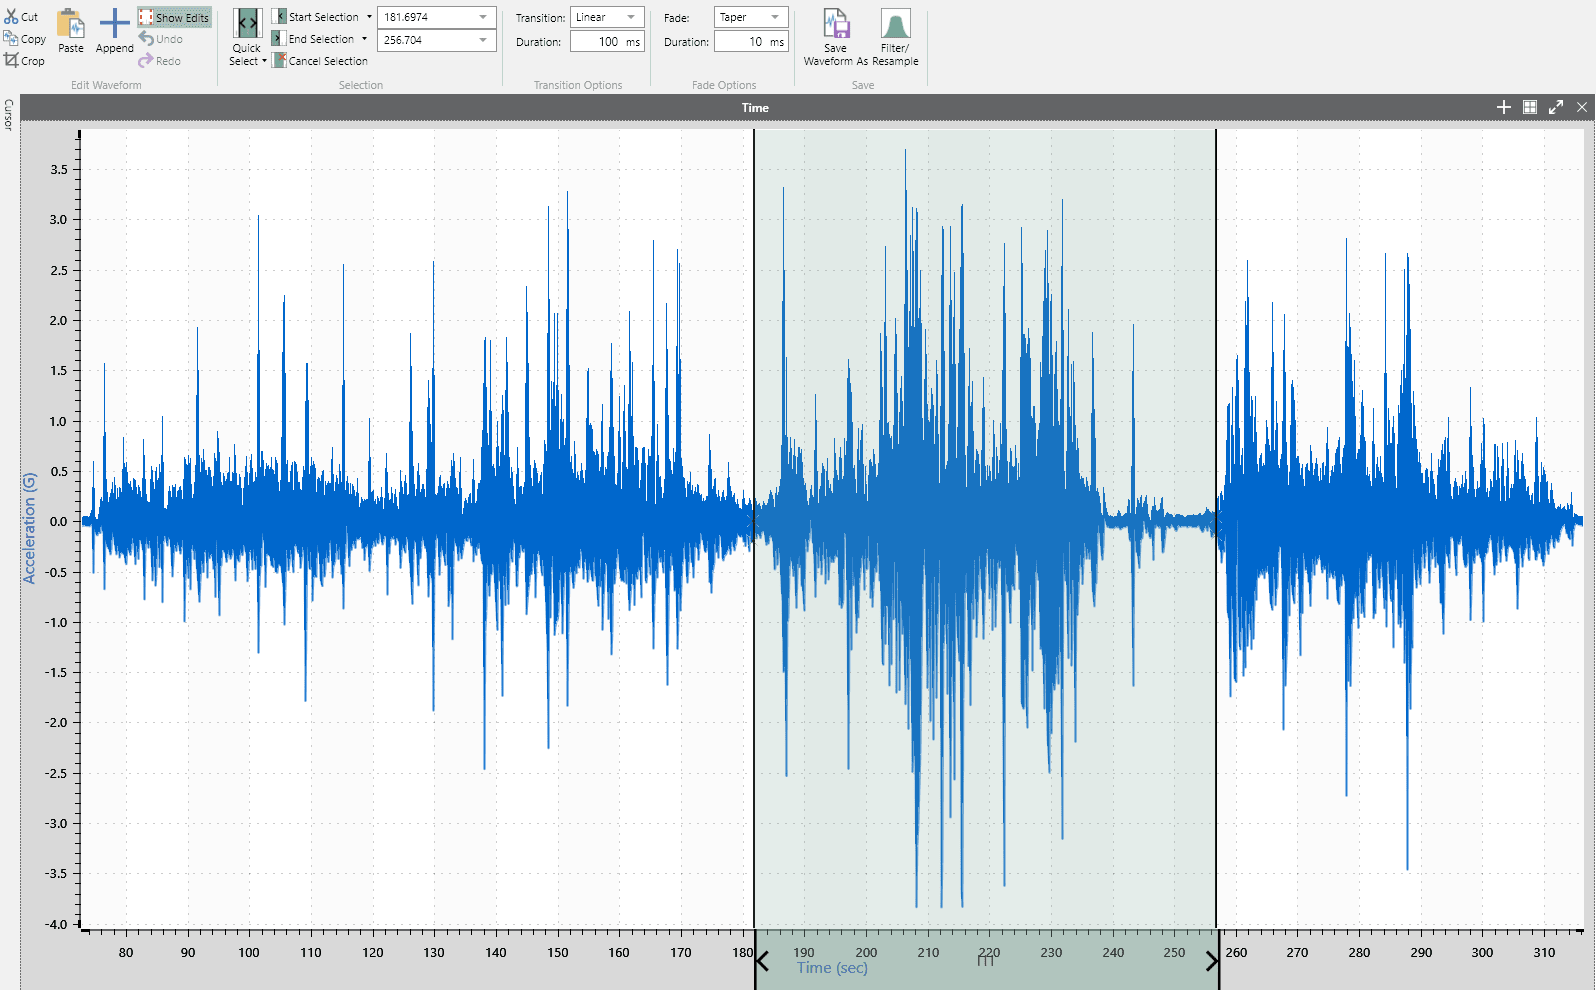
To select a portion of a graph, select the Quick Select button and adjust the inserted selection. Alternatively, select the Start Selection and End Selection button or use the I and O keys.

A selection of time-waveform data using the Editor menu options.
Selections can be cut or copied to the Windows’ clipboard. Alternatively, a selection in the Windows’ clipboard can be pasted into the selected section.
The Append button calls the Open dialog where the user can select one or more time waveform files to append to the open file. If the files are compatible with the open file, the data from the files will be appended to the end of the current graph data. If a file is not compatible, a message will appear with more details.
The user can set the transition and fade to smoothly merge waveforms or end points. The transition options apply to the edit points in the middle of the waveform; the fade options apply to the beginning and end of the waveform.
Export Data
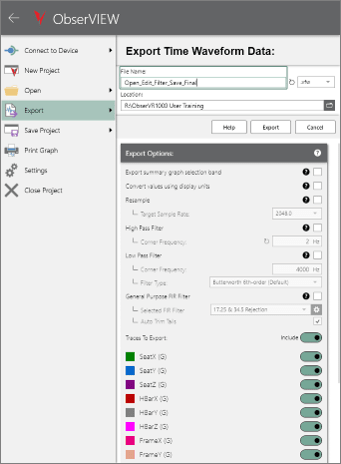
The user can export the time-waveform data after editing. Before export, they can resample the waveform or apply filters.
Note: Filtering and resampling are advanced features. Depending on your license, you may not be able to use them.

Export options in ObserVIEW.
To export, click File > Export. The export options are located below the file name, type, and location. The available export options for Advanced licenses include:
- Resample
- High Pass and Low Pass IIR
- General Purpose FIR
The available file types for export include:
- VFW: VibrationVIEW field waveform
- MAT: MATLAB data
- CSV: Comma-separated value
- TXT: Text
- UFF 58 b: Universal file format binary
- UFF 58: Universal file format UTF-8
- WAV: Waveform audio file

