Analyzing Field-recorded Data for Vibration Testing
December 30, 2025
Measuring Field Environments
Test Monitoring in the Lab
Back to: Recording & Implementing Vibration Test Data
The goal of field-data analysis is to translate real vibration environments into meaningful test specifications. By identifying dominant frequencies, transients, and energy distributions, engineers can be confident that their lab tests accurately reflect field conditions.
Field-data analysis supports tasks such as:
- Establish initial reference points
- Quantify shock/transient events
- Translate time-history files
- Establish environmental baselines
- Explain system-level behavior
- Evaluate fatigue and durability
Establish Initial Reference Points
When reviewing time waveform data, engineers can determine the minimum and maximum acceleration levels. In the ObserVIEW analysis software, this task can be completed with the min and max cursors. Engineers can also review the waveform statistics in the Statistics pane, including the minimum and maximum values.
Engineers must determine if peak values are transient events, such as a shock or impact. Transient events may require a separate testing plan if they affect the test item’s performance or durability.
Even a simple time analysis of field data can lead to better testing. With time-history statistics, engineers can:
- Isolate sources of vibration, shock, or anomalies
- Check material and interface capabilities against peaks
- Add transient events or extreme conditions to test specifications
- Establish test boundaries and safety factors
- Identify representative vs. extreme environments
At this step, engineers can also use statistical trend tracking, such as RMS or kurtosis vs. time, to detect performance changes or degradation.
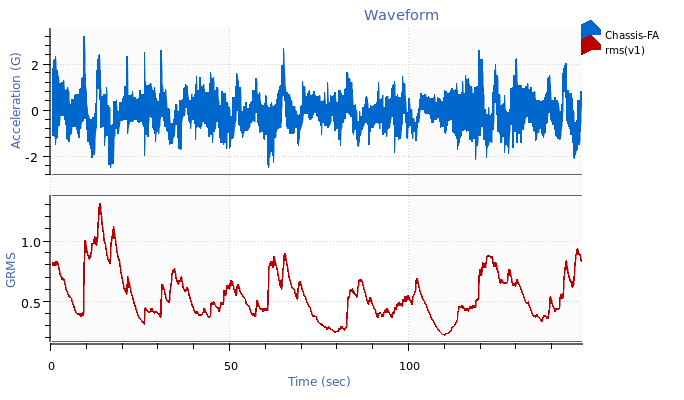
Acceleration waveform and RMS math trace in ObserVIEW.
Quantify Shock or Transient Events
The averaging process applied during random vibration testing typically normalizes transient events. As such, engineers usually run separate mechanical shock tests for significant transient events on samples that undergo random testing.
Some field environments contain transient events that influence test item performance or durability. If needed, engineers can:
- Isolate transient vs. broadband vibration with filtering
- Quantify severity with the shock response spectrum (SRS)
- Determine if shock qualification is necessary
This step helps establish appropriate test limits when both vibration and shock exposure occur in the field.
Translate Time-history Files
Time waveforms reveal peaks but offer limited context. Converting the waveform to a frequency-domain representation provides a different perspective of vibration behavior.
Power Spectral Density (PSD)
The PSD estimates the distribution of signal strength across a frequency spectrum. In ObserVIEW, engineers can generate a PSD by selecting its graph type. A basic understanding of the PSD calculation is beneficial for selecting the most fitting analysis settings, such as lines of resolution.
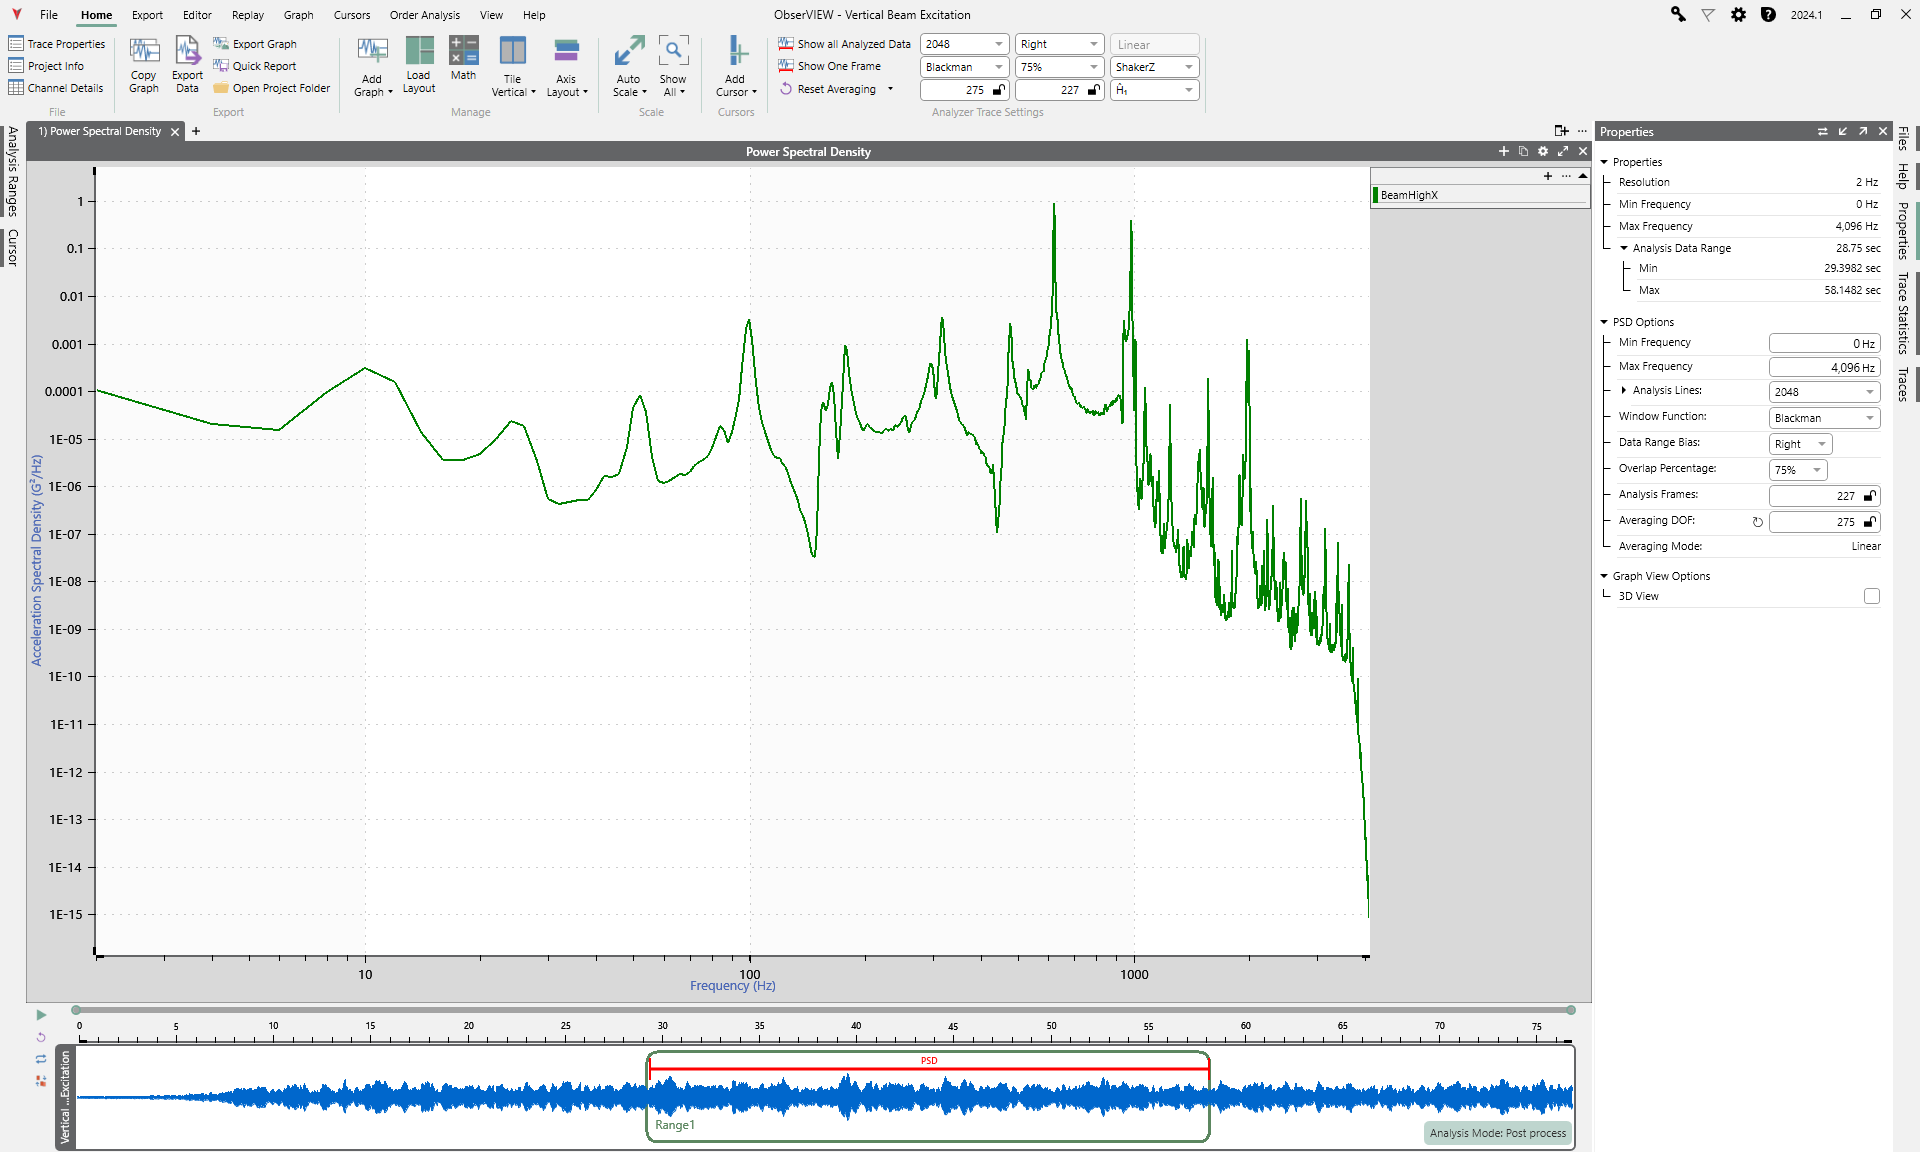
PSD graph in ObserVIEW. The user-defined properties are in the pane to the right.
After generating a PSD, engineers can:
Examine peaks in the PSD to identify dominant frequencies, i.e., frequencies where the vibrational energy is the highest. Dominant peaks are often linked to specific components, transient events, structural modes, or operation conditions (such as RPM).
Assess the PSD amplitude across the frequency range to characterize the environment’s severity and compare it against known design limits or specifications.
Overlay the PSDs with the same parameters from multiple measurements to compare vibration and energy distribution.
Identify resonances, which appear as sharp, narrow peaks in the PSD. Verify these resonances by inspecting the test item’s modal shapes or re-measuring it with different boundary conditions.
Compare PSDs from repeated measurements to detect shifts in peak frequencies or amplitude, signaling wear, imbalance, or changes in system stiffness.
Root-mean-square (RMS)
The strength of a PSD is denoted by its RMS value. After a PSD is generated with a fixed frequency resolution, its RMS value remains constant. This consistency allows engineers to match a PSD to a specification and determine if the RMS is within tolerance. They can also use the RMS to compare two PSD plots with the same parameters and verify that they measure the same amount of energy.
Sine-swept Profile
From a PSD analysis of field data, an engineer can better understand the concentration of energy and identify dominant frequencies. They can use this information to define a swept-sine test profile, which engineers often use for resonance searches or transmissibility checks.
Field data can also inform sine sweep parameters, including the frequency bandwidth and sweep rate.
Sine sweep test results can confirm the resonant frequencies estimated by the field-data PSD. Engineers can also use this test data to characterize damping, transmissibility, or structural response.
FFT & Spectrogram
In addition to the PSD, engineers often use FFT and spectrogram graphs to:
- Track frequency content that varies over time
- Identify intermittent resonances
- Highlight operating conditions that produce different frequency behaviors
While time and PSD analyses help set baselines, tools like the spectrogram detect changes over time.
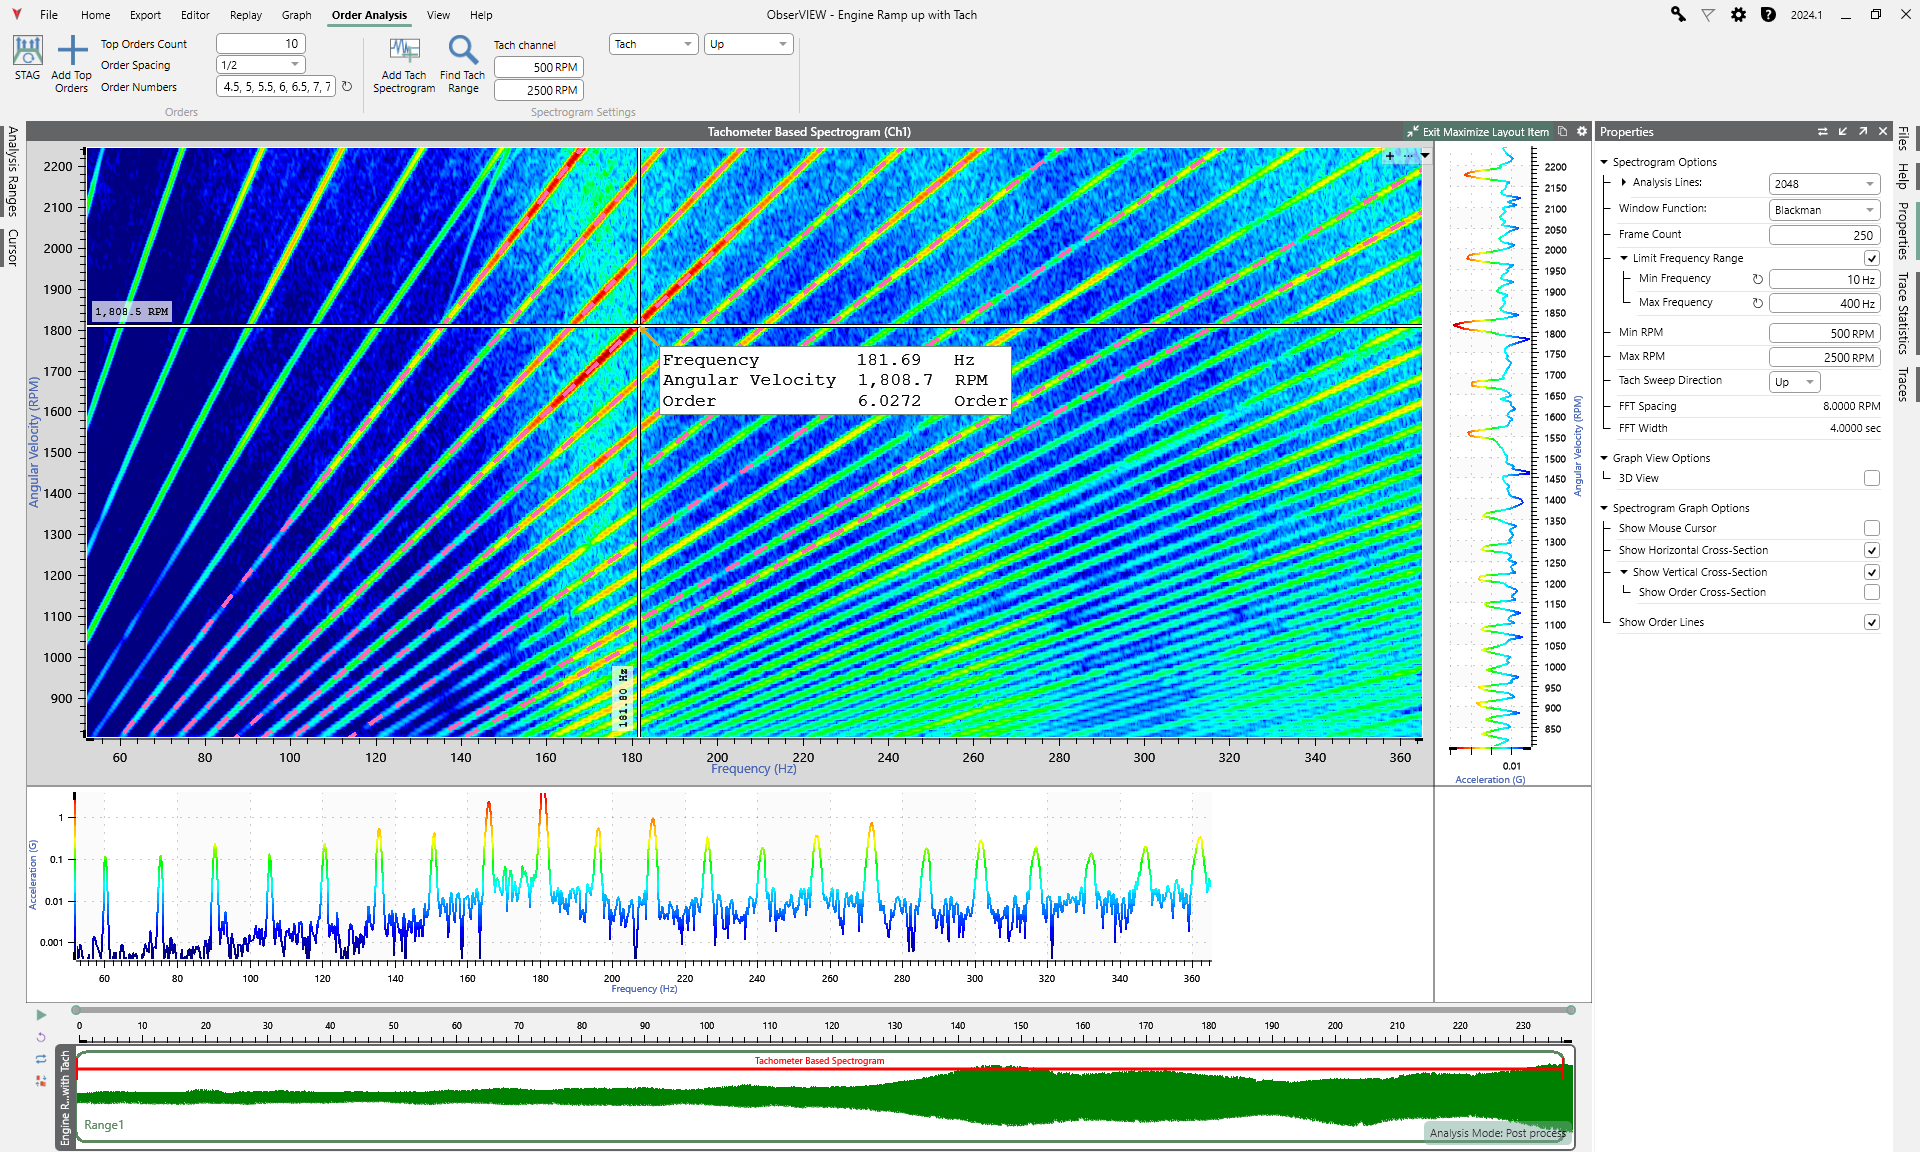
Tachometer-based spectrogram in ObserVIEW from an engine ramp-up.
Establish Environmental Baselines
Engineers track changes in peak frequencies, RMS levels, or PSD amplitude. Over time, these data support condition monitoring and predictive maintenance.
A representative field recording often serves as a baseline for:
- Detecting shifting vibration characteristics due to wear or design changes
- Comparing new measurements against earlier environments
- Confirming that updates to components or fixtures do not alter vibration behavior
Explain System-level Behavior
Tools like the PSD identify component frequency behavior, but engineers must also understand the interaction of components and the transfer of vibration.
Signal comparison tools help map system-level behavior. Engineers can use graphs like coherence, transfer function, and cross-spectral density to:
- Validate fixture and mount design
- Accurately replicate boundary conditions
- Improve digital twin stiffness and damping assumptions
- Understand how vibration propagates through the structure
Transmissibility peaks from a time waveform analysis.
Evaluate Fatigue & Durability
Moving from environment characterization to reliability, engineers use fatigue analysis to determine how the field environment influences long-term wear and damage. Fatigue analysis helps predict a product’s life expectancy and anticipate potential failures during standard use. Tools like the fatigue damage spectrum (FDS) and probability distributions help engineers:
- Generate statistical distributions for vibration loads
- Design accelerated tests that represent high-percentile field conditions
- Estimate fatigue life using realistic exposure profiles
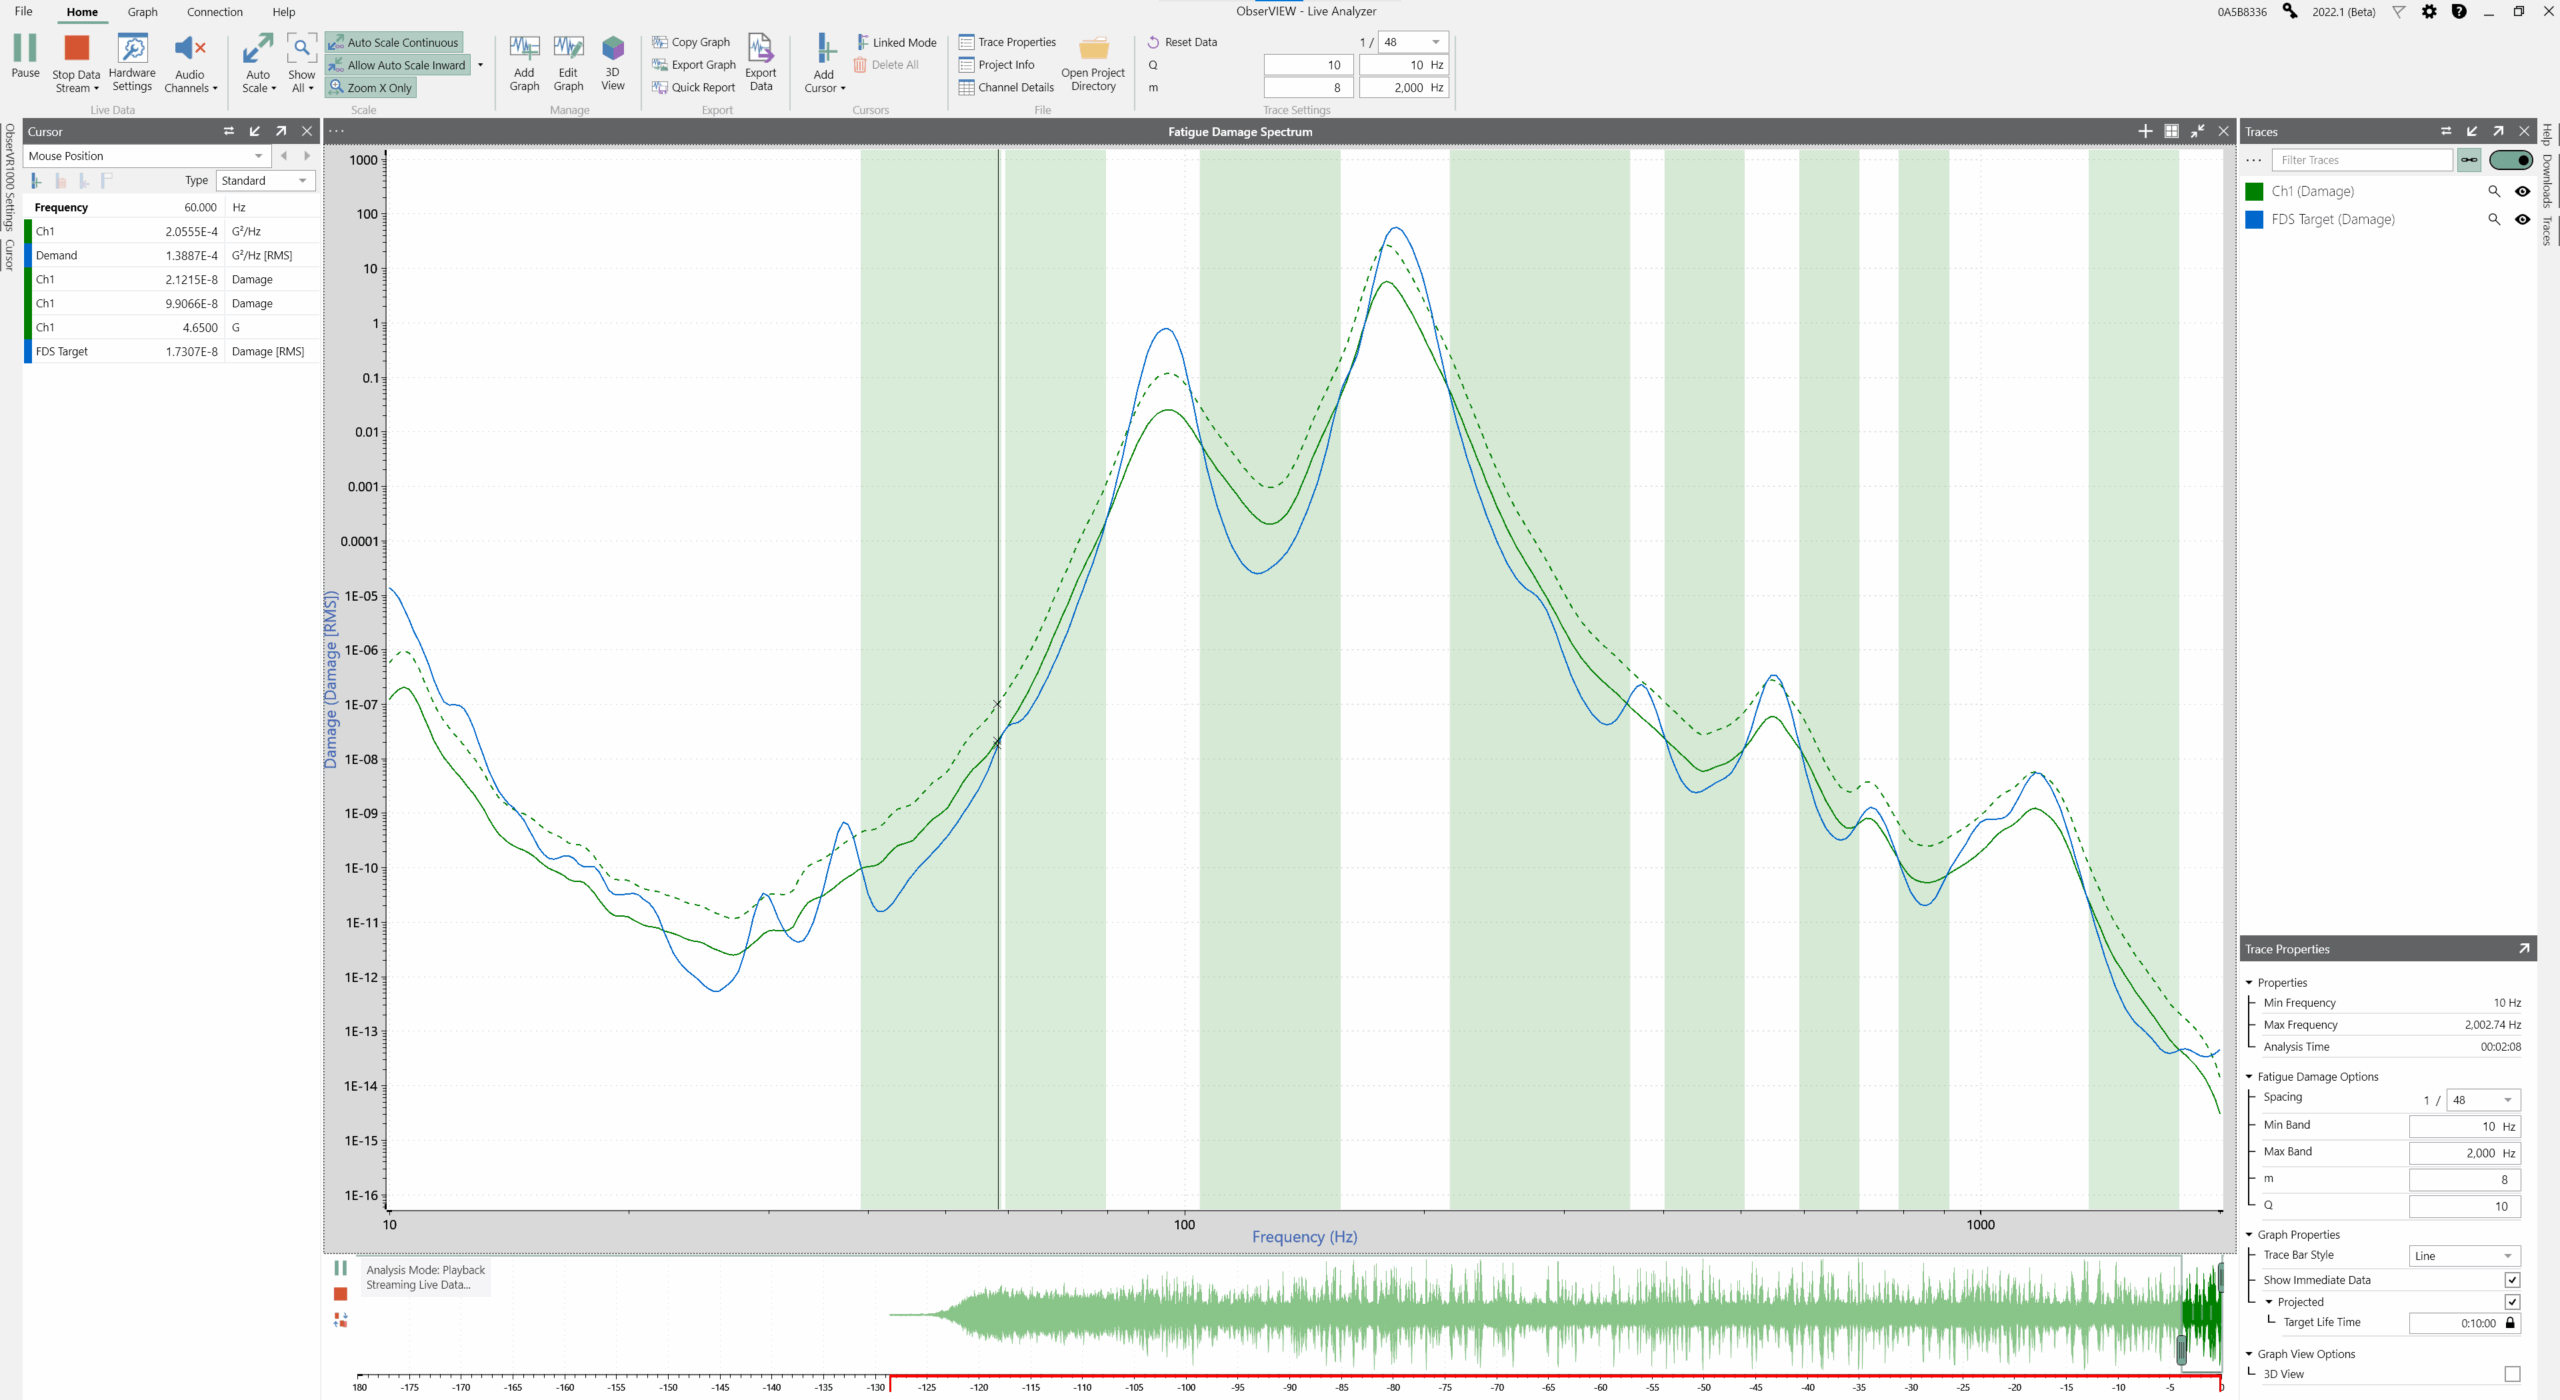
Fatigue damage spectrum graph comparing actual damage to projected damage.
Conclusion
There are numerous ways an engineer can go about analyzing field-recorded vibration data. This lesson has detailed several common methods. ObserVIEW supports many other approaches to analysis, including custom operations with math traces.