Waveform Analysis Using Sampling
July 8, 2019
Sampling
Frequency Domain Consequences of Sampling
Reconstruction Via Interpolation
Quantization noise and over-sampling
Differential Quantization / Delta Modulation
Noise Shaping / Delta-Sigma Modulation
Back to: Sampling & Reconstruction
Sampling is one of many methods to perform signal analysis. Similar to other analysis methods, sampling separates a waveform, x(t), into weighted components. Typically, the components are the basis for the waveform. The weights are called Fourier coefficients, even if we are not using a Fourier transform.
(1) 
where each 𝜙n(t) is a basis vector (function) and each ⟨x(t) | 𝜙n(t)⟩ is a Fourier coefficient.
Examples
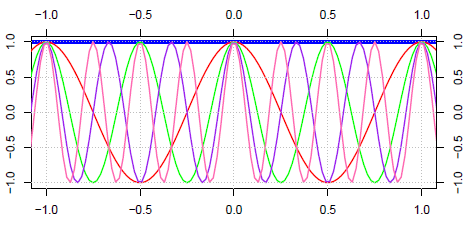
In the case of the inverse discrete-time Fourier transform (IDTFT), the set of all functions, 𝜙n(t) ≜ eiwn, is the basis. The set of all values, ⟨x(t) | 𝜙n(t)⟩, is the DTFT of x(n), as shown in Figure 1.5.

Figure 1.5. Fourier basis.
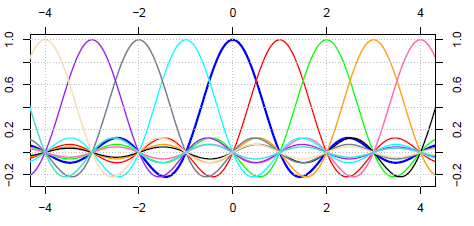
In the case of typical sampling, the basis functions are sinc functions shifted by integer multiples of the sampling period 𝜏, and the Fourier coefficients are simply samples, x(n𝜏), of x(t), as shown in Figure 1.6.

Figure 1.6. Sampling basis.
Wiggly Waveform Analysis using Sampling (Ex. 3)
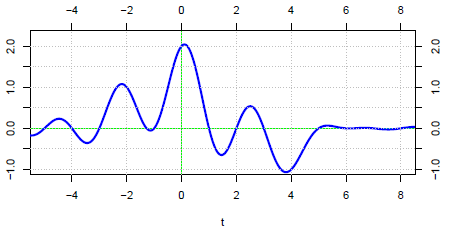
Suppose x(t) is the waveform illustrated in Figure 1.7.

Figure 1.7. Wiggly waveform.
Assume x(t) has a bandwidth less than or equal to 0.5Hz. Then, sample x(t) at 𝖥s = 1Hz as shown in Figure 1.8.

Figure 1.8. A sampling at 1Hz.
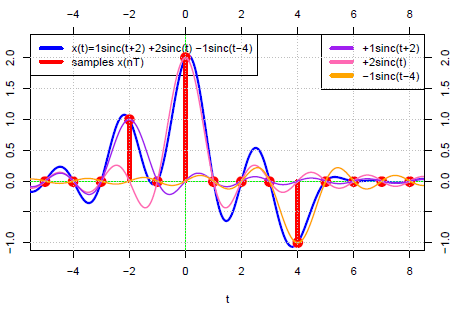
There are exactly three non-zero samples. This means that 𝗑(𝑡) is the weighted sum of three non-zero sinc functions. The three weights are the three non-zero samples (1, 2, and -1) such that x(t) = 1 sinc(𝑡 + 2) + 2 sinc(𝑡) − 1 sinc(𝑡 − 4) as illustrated in Figure 1.9.

Figure 1.9. Sinc components of x(𝑡).
