Time vs. Frequency Domain
October 19, 2021
Fundamentals
Waveform Display
Domains for Analysis
Random Vibration
Back to: Introduction to Vibration Signals
In vibration testing, engineers typically analyze data in the time and frequency domains. Electronic sensors measure the physical parameters of vibration and then transmit a signal conveying the measurement data to a control instrument. Then, a standard algorithm can move the time-domain data to a different domain.
Time-History Waveform
Test engineers can analyze and process data differently in the time and frequency domain. A signal in the time domain displays a measured parameter (amplitude, displacement, etc.) as a function of time. Typically, engineers use a time-history graph to observe changes when the frequency changes over time.
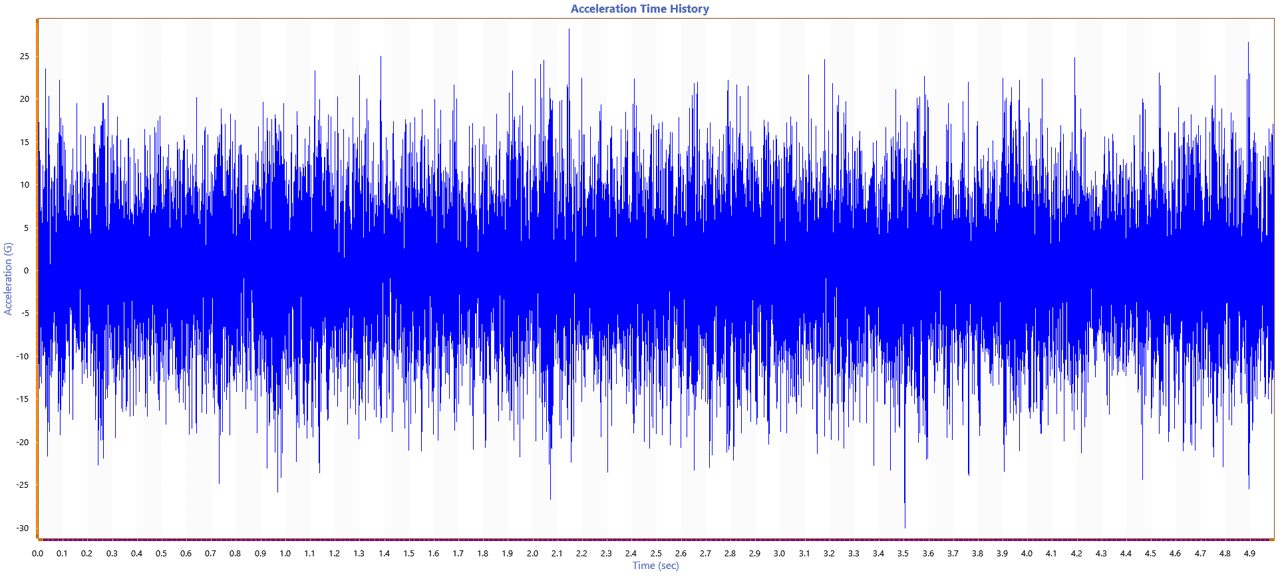
Acceleration time-history waveform.
A dynamic signal analyzer records time-history waveforms. The recorded data are defined in units: a scale used to measure a given quantity.
Engineers can then use the time-history data to measure parameters related to the behavior of the device under test, such as peak levels. Other useful data can be extracted from the frequency domain.
AVD Conversion
In vibration testing, acceleration, velocity, or displacement are often the dependent variable. Integration and differentiation filters can convert the variables from acceleration to velocity to displacement (or reverse). Integration and differentiation are inverse operations of calculus.
An integration filter converts acceleration to velocity and then velocity to displacement. An integral assigns a number to a function to describe a concept (in this case, acceleration, velocity, or displacement). For a variable x and an interval [a, b], the integral of a function f is called the “area under the curve.”
Conversely, a differentiation filter converts the displacement to velocity and then velocity to acceleration. The derivative of a function measures the “instantaneous rate of change” of output to the input. It is equivalent to finding the slope of the tangent line at a specified point.
Frequency Domain
As all signals are acquired in the time domain, a waveform must be transformed to analyze the data in the frequency domain. There are several standard methods to do so, but perhaps the most popular method is the fast Fourier transform (FFT).
Fast Fourier Transform
The FFT is an algorithm that converts a digitized signal from the time domain to the frequency domain. The time data are divided into frames of equal time length, and an FFT is calculated for each frame.
Following this linear transformation, engineers can observe the frequency content of the time-history waveform and gather information, such as excitation frequencies, peak acceleration and distribution, and harmonic content.
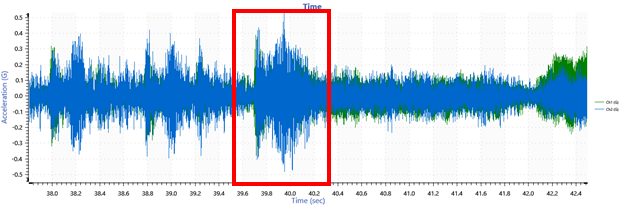
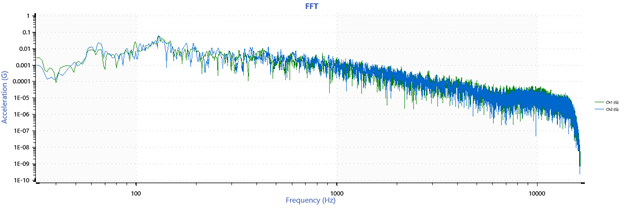
A section of a time-history waveform converted to the frequency domain.
The power spectral density (PSD), a tool used to analyze random vibration, can be calculated from a series of FFTs. The FFTs for each frame are windowed and averaged together, which results in a graph that characterizes the amount of vibration energy within various frequency bins.
Other Analysis Tools
Several other graphs are accessible in the frequency domain, including:
- Transmissibility: Displays the PSD relationship between two signals, such as signals from accelerometers on a shaker head and a DUT, or accelerometers for two different axes on the DUT.
- Transfer Function: Similar to transmissibility, displays the ratio of PSD values for two signals across a specific frequency range. A second graph shows the phase relationship between the two signals.
- Coherence: Communicates how the response signal during a test is related to the drive signal. Values for coherence will be between 0 and 1, where a value of 0 indicates no relationship between the two signals, and a value of 1 indicates a perfect relationship between the two signals.
In addition to time and frequency, vibration analysis can be performed in more specialized domains such as the modal or angular. However, most testing takes place in the time and frequency domains.