Digital Sampling
October 19, 2021
Fundamentals
Waveform Display
Domains for Analysis
Random Vibration
Back to: Introduction to Vibration Signals
Vibration testing makes use of both analog and digital signals. An analog signal is continuous in time and amplitude, while a digital signal is discrete in both.
Test engineers perform signal analysis on a discrete signal. They quantize continuous signals to form discrete ones using an analog-to-digital converter (ADC). This process uses the mathematical operation of digital sampling.
Digital Sampling
Digital sampling takes samples of a waveform at different intervals and transforms them into a sequence of values. Each sample in a signal has a sample number.
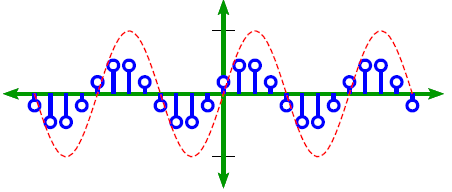
Sampling a sine waveform.
In vibration testing, sample numbers run from 0 to N – 1, where N equals the total number of samples. The number of samples per second from a continuous sample that composes the discrete signal is called the sample rate.
On a graph, the dependent variable is a function of the sample number or some other domain, such as time. The discrete signal may appear as individual plots or a continuous line.
Methods
Perfect reconstruction of a waveform using samples is not impossible but it is improbable. Quantization always introduces quantization noise. Additionally, signals are often band-limited due to low-pass, anti-aliasing filters.
Statistics or digital signal processing (DSP) can perform digital sampling. Statistical sampling offers a better understanding of the fundamental nature of this process. DSP transforms data into a sequence that mathematical operations, such as filters, can further transform.
After the engineer acquires the digital signal, they can analyze and adjust it if necessary. The subsequent steps depend on the data acquisition and test objectives.
Linear and Logarithmic Graphs
Engineers can view the graph of a signal on a linear or logarithmic display and scale the x-axis and y-axis independently. A linear graph scales the values uniformly, and a logarithmic graph bases the scale on exponential calculations.
The graph display can influence how the engineer interprets the data. For a simple data set, a linear graph is easy to interpret. However, data with a span of several orders of magnitude will not display well on a linear scale because it condenses the values. For an accurate analysis, the graph should best reflect the characteristics of the recorded data.