Supplemental SRS Analysis: IEEE 344
December 30, 2022
As discussed in previous lessons, classical shock pulses represent vibration as a function of time. They are often simplified representations of real-world transient events.
To better evaluate a test article’s response, engineers use the shock response spectrum (SRS), which characterizes the maximum response of a series of single-degree-of-freedom systems over a range of frequencies.
SRS test profiles are defined as a function of frequency, and the resulting data are plotted against frequency. Rather than representing the frequency content or energy distribution of the input signal, SRS plots show the peak response that systems at different frequencies would experience.
Because SRS reduces a time-history to peak responses, engineers often supplement SRS test data with additional analysis to confirm that the synthesized input adequately represents the real-world event.
SRS Plot
When analyzing complex shock, engineers are interested in the maximum acceleration at each frequency bin rather than the average. Peak values signify potential damage, whereas an average might conceal potential issues.
Shock response spectra show the maximum acceleration a system would experience at each natural frequency. It displays the magnitude of the peak response, aligning with how mechanical systems respond to shock. However, many different pulses can result from the same SRS or similar spectra because it does not preserve other information, such as phase.
With the SRS, engineers can best visualize the effects of a shock on a physical system. They can determine the maximum dynamic load of a component or system as a function of frequency and correlate it to the damage potential based on an input response. Although an SRS response cannot generate the original pulse, the engineer can use supplemental SRS analysis to determine if it reflects the transient event.
Supplemental SRS Analysis
The SRS transform is many to one, meaning a range of waveforms can produce the same SRS in terms of amplitude, duration, and frequency content. Supplemental analysis is needed to ensure the pulse represents the real-world event.
IEEE/IEC 60980-344 – Nuclear facilities – Equipment important to safety – Seismic qualification cites several parameters for this type of analysis:
- Coherence
- Correlation
- Stationarity
- Measurement of the ZPA
- Peak stress cycle counting
Coherence
Earthquake motion is statistically independent when measured at a distance from the epicenter. Artificially generated time histories should possess a similar amount of statistical independence. Coherence and correlation functions verify statistical independence.
Coherence examines the relationship between two signals. The coherence graph confirms if the response signal is related to the drive signal across the frequency domain. Values for coherence will be between 0 and 1. Perfectly independent signals yield a value of zero, and perfectly dependent signals a value of +1.0.
The coherence defined in IEEE 344 requires a value of less than 0.5. IEEE 344 defines the procedures that demonstrate that Class 1E equipment can perform during a seismic event.
Stationarity
IEEE 344 defines stationarity in Annex B. Stationarity maintains a waveform’s frequency content and a consistent excitement of all vibration modes (uniform presence of energy).
Test engineers use frequency content and stationarity to create a waveform representative of a seismic event. The frequency content is in the form of a power spectral density (PSD) function. The input waveform must be statistically constant over time, which a waterfall PSD can achieve. The engineer evaluates the waterfall PSDs for uniformity and compares them to the recorded event.
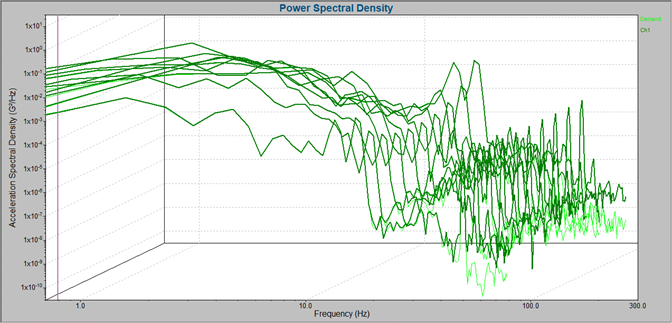
A waterfall PSD plot.
Measuring the Zone of Polarizing Activity (ZPA)
IEEE 344 defines the ZPA in Annex A. Zero-period acceleration is the acceleration level of the high-frequency, non-amplified portion of the response spectrum. It corresponds to the maximum peak acceleration of the time-history waveform from which the response spectrum is derived. Zero-period acceleration is also known as peak acceleration.
The ZPA measurement confirms if the test response spectrum (TRS) has enveloped the required response spectrum (RRS). The ZPA of the TRS should only consider the frequencies within the RRS-amplified region.
If the TRS indicates the presence of high frequencies, the engineer can implement low-pass filtering above the RRS cutoff frequency to show the true ZPA value.
All shaker tables introduce waveform distortions. The true zero-period acceleration can only be measured through filtering at the cutoff frequency. Filters support accurate and relevant time-domain data acquisition. They ensure that the data limiting the mechanical motion of the shaker is correct.
Peak Stress Cycle Counting
IEEE 344 defines the peak stress cycle in Annex D. The peak stress cycle counts the equivalent full-amplitude cycles and ensures that the waveform motion is consistent with frequency content and duration.
Test duration alone may not be sufficient to ensure an adequate equipment response relative to the low-cycle fatigue capability. A conservative seismic test requires the input to generate a certain amount of strong-motion-response cycles in the equipment. A stress cycle counting function verifies this.