Using Recorded Data to Improve SRS Tests
March 16, 2022
Analyzing Waveforms
Reproducing Waveforms
Fatigue Damage Spectrum (FDS)
Sine-on-Random (SoR) Test Generation
Shock Response Spectrum (SRS)
Back to: Test Development with Recorded Data
Various parameters go into synthesizing a pulse equivalent to a specified shock response spectrum (SRS). The testing industry relies on a set of standard synthetic waveforms to develop an SRS.
Standard Synthetic Waveforms
- Linear Chirp
- Exponential Chirp
- WavSyn
- Burst Random
- Linear Chirp on Burst Random
- Exponential Chirp on Burst Random
- Enveloped Burst Random
- Damped Sine Waves
There are variations of most of these waveforms. For example, the WavSyn synthesis can be centered, aligned left, sequential, or alternating.
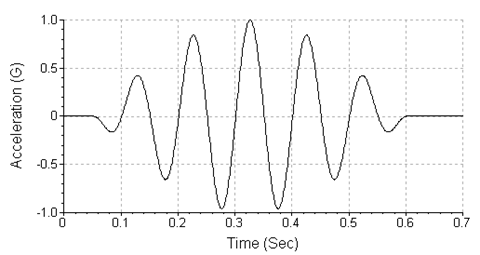
WavSyn wavelet with Frequency=10 Hz, Amplitude=1 G, and N=11.
Selection Process
Selecting the correct synthetic waveform type depends on the intended application. For example, WavSyn produces a short duration, high-frequency waveform well-suited for pyro shock tests. The Burst Random and Enveloped Burst Random methods produce long-duration, stationary random waveforms that are appropriate for earthquake tests.
Read more: Characteristics of Synthetic SRS Waveforms
Oftentimes, the frequency response of a synthetic pulse cannot match a real-world transient event. To approximate an event, the synthetic waveform must test the device across the range of frequencies found in the field environment.
A synthesized waveform without the correct low-frequency or high-frequency vibrations will not result in a realistic test. Furthermore, a waveform with excessive energy in a frequency range can result in over-testing.
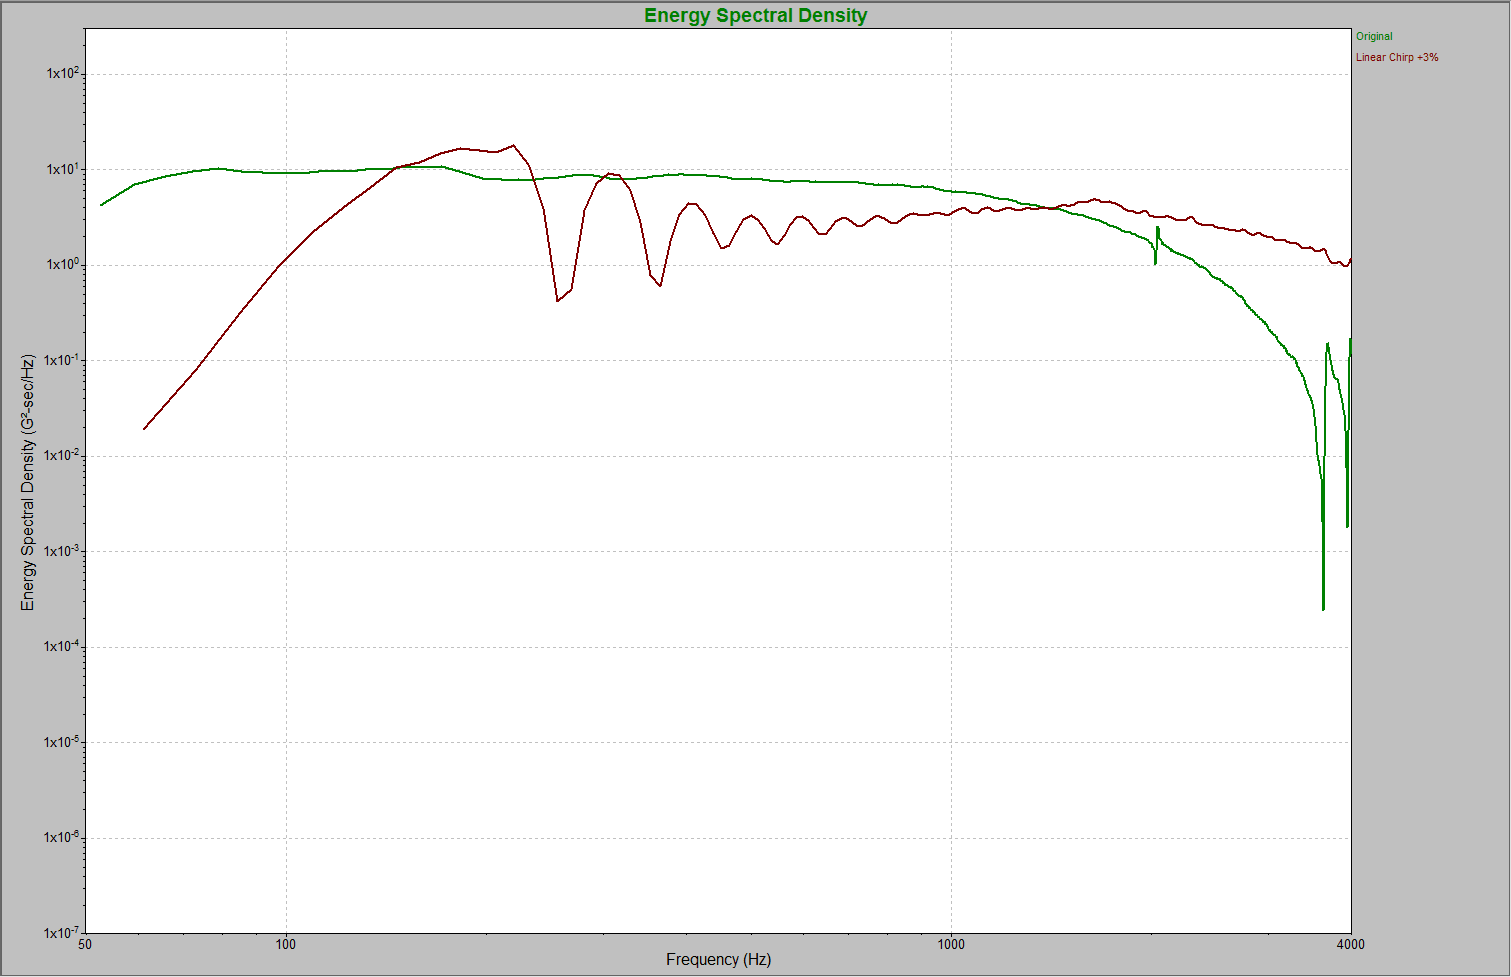
A Linear Chirp waveform overlaid on the original recording.
Using Field-Recorded Data
A field-recorded waveform can be modified to meet or exceed a specified SRS. The resulting time waveform will be similar to the field environment. Most importantly, the frequency response reflects the the device under test (DUT) under field conditions.
Creating an Enveloped Set of Recordings
A time-waveform recording may represent a single unique event. However, using one event as the basis for a synthesized SRS waveform gives an incomplete description of the shock vibrations that may occur in the field. To avoid this, engineers can combine multiple recordings into one waveform.
For transient events, the correct way to combine multiple field recordings is to find the maximum acceleration value at each frequency (not the average). This “max enveloping” technique produces an SRS curve using the maximum acceleration at each frequency from a group of real-world recordings.
The process of producing an enveloped SRS using the VibrationVIEW and Excel software tools is as follows:
- Load recordings: Individually load several waveform recordings of the same event into VibrationVIEW.
- Copy the data to Excel: Copy the data file for each recording in VibrationVIEW and paste it into an Excel worksheet.
- Determine the maximum of each recording at each frequency (envelope): In Excel, select the maximum acceleration value for each frequency.
Creating a Modified User Waveform
Parameters for SRS synthesis are used to create a pulse that matches a specified SRS curve. Use the following steps to produce a user-modified waveform based on enveloped recording data.
- Import a real-world data file (as .txt) to begin building a user-defined transient: Select one of the real-world recordings and import the recording’s data file as a User Defined Transient test type.
- Use the enveloped data to create a maximax breakpoint table: Select and copy the max envelope data file from the Excel worksheet and paste it into the breakpoint table section of the User Defined Transient test profile.
- Synthesize a modified user waveform: In the VibrationVIEW User Defined Transient test, click the SRS tab, select From User Waveform, and click Synthesize.
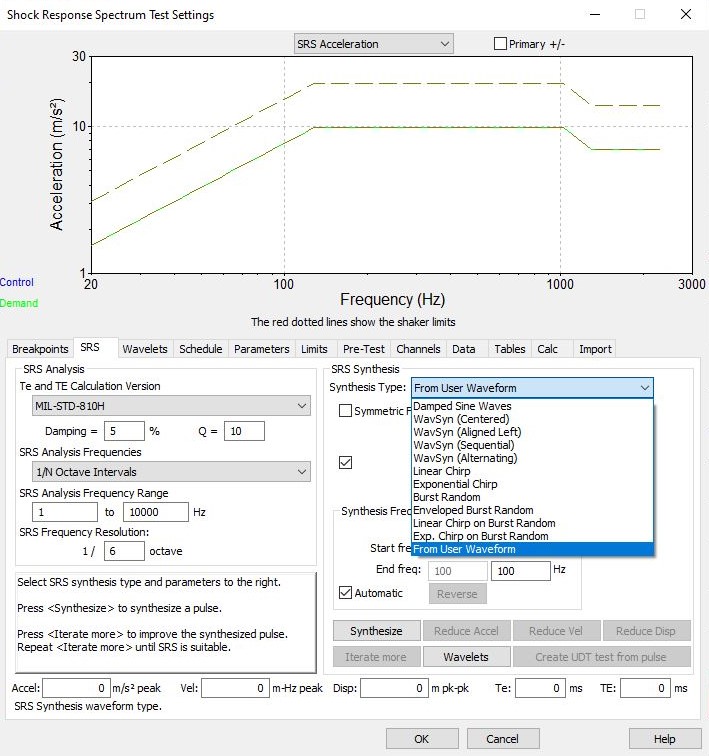
User-defined waveform option under SRS Test Settings in VibrationVIEW.
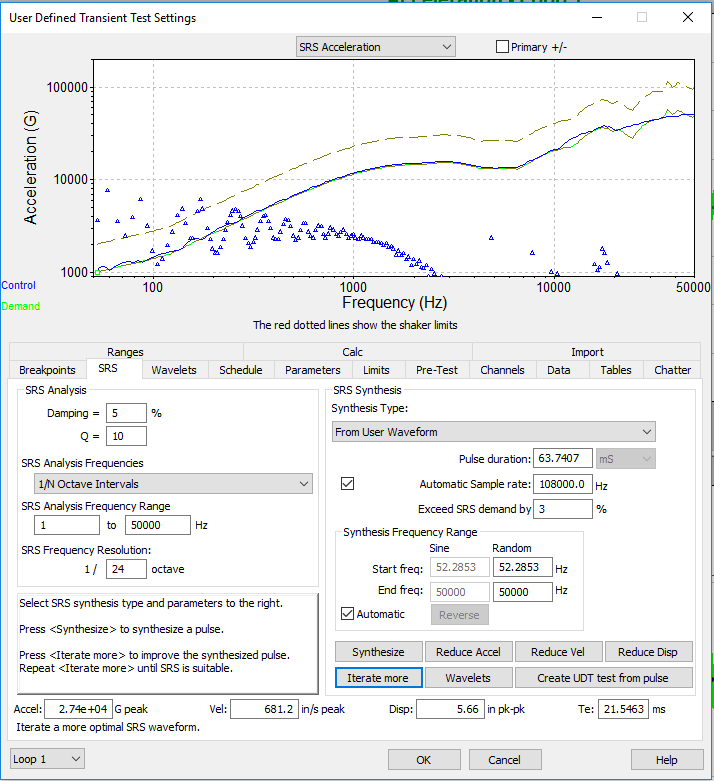
- Iterate as necessary: Clicking Iterate More adjusts the wavelets, which adjusts the SRS to create a waveform that meets or exceeds the SRS maximax breakpoint table values.
- Run the test: Save the test profile and run the test. Running the test will generate a data file for the synthesized waveform that can be compared to the real-world data.
Comparing Waveforms
The waveform developed from the enveloped data and standard synthesized waveforms can be evaluated by comparing them with a recorded waveform.
First, consider the waveform shape. A mechanical shock test profile must test the DUT at the correct amplitudes across the frequency domain to be realistic.
Frequency content is also telling. An accurate synthetic waveform must test a DUT for the same frequency range as the real-world waveform. A synthesized waveform without the correct low- or high-frequency vibration will not result in a realistic test.
Lastly, engineers should consider the waveform’s energy or amplitude. In addition to the correct waveform shape and frequency content, an accurate test profile must also have the same amplitude as the real-world waveform.
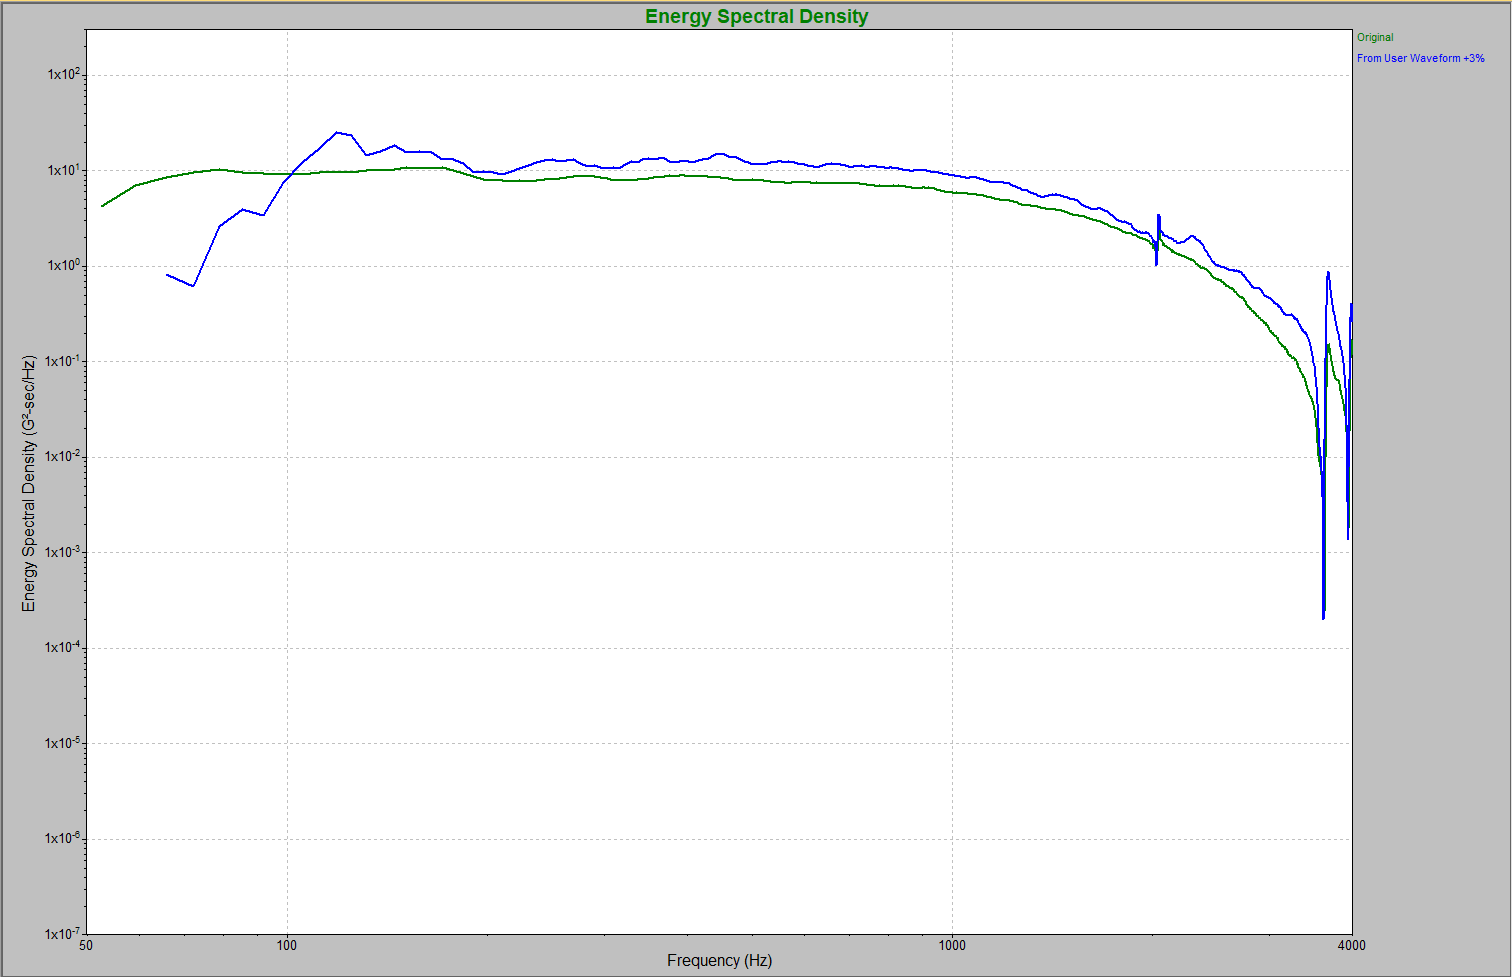
Modified user waveform overlaid on the original recording.
Conclusion
A modified user waveform generated with the max enveloping technique yields an SRS waveform similar to the field recording in terms of waveform shape, frequency content, and amplitude.
Standard synthetic waveforms often do not match real-world transient events. They are generated with mathematical algorithms and cannot match the realistic qualities of a modified user waveform.
Based on an enveloped set of real-world recordings, the modified user waveform maintains real-world characteristics and creates an SRS waveform that accurately reflects those recorded events.