Evaluating & Using Data
March 29, 2018
Background
Using VibrationVIEW
Laboratory Exercises
Reference
Back to: VibrationVIEW Syllabus
Understanding and evaluating vibration test data helps explain its effect on the test item.
- At what frequency did the device under test (DUT) fail?
- How does the test compare to the required standards? How much acceleration did the DUT experience at a particular time or frequency?
- How much displacement is required from the shaker to run the test profile?
The graphs and data generated by the VibrationVIEW software can answer these questions and more.
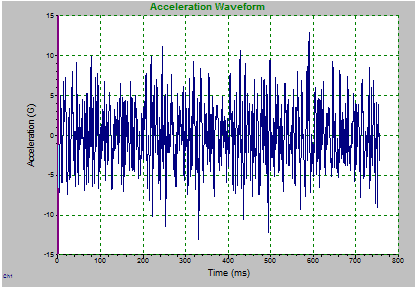
Acceleration Waveform
The acceleration waveform graph displays the acceleration experienced by the DUT for a snapshot of time. Specifically, it is the acceleration value measured at the accelerometer’s location at a specific moment in time.
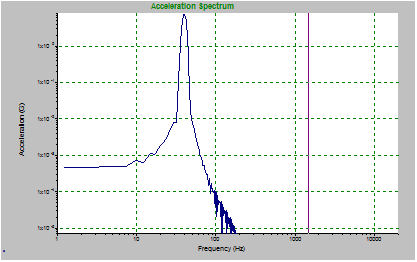
Acceleration Spectrum
The acceleration spectrum is mostly used in System Check. It displays the changes in acceleration with respect to frequency. This graph is useful for observing harmonic frequencies and noise.
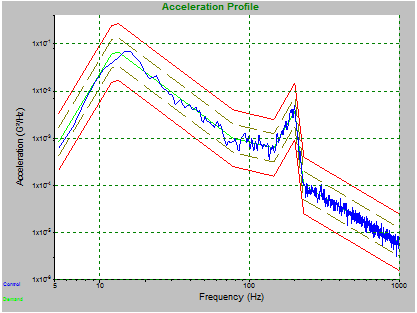
Acceleration vs. Frequency Graph (Acceleration Profile)
The Acceleration vs. Frequency graph displays the test progression and the test profile’s user-defined tolerance and abort limits. Engineers can use it to view resonances or noise in relation to the control channel via a response accelerometer.
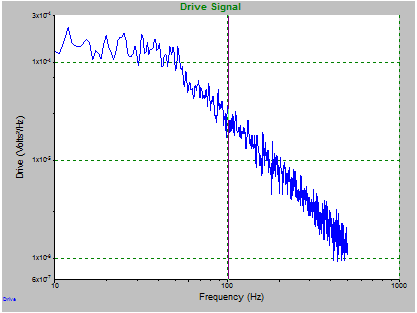
Drive Signal
The drive signal displays the voltage density as it changes with respect to frequency.
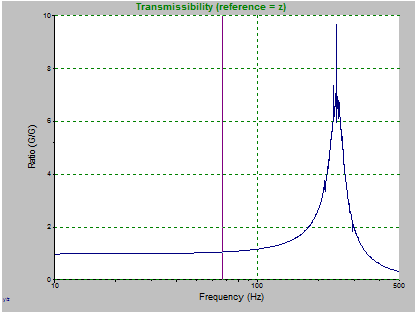
Transmissibility
Transmissibility is a ratio of the acceleration of one channel to another. Engineers use it to view resonances.
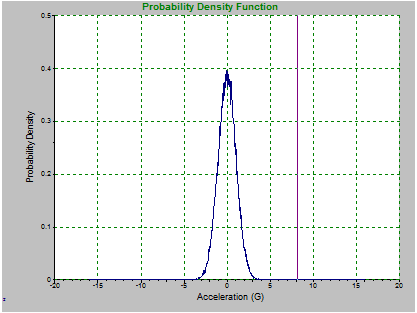
Probability Density Function (PDF)
A PDF indicates how the acceleration of a test profile is distributed. As a test progresses, the graph will curve where the majority of the test acceleration is occurring. To observe how the curve is generated, look at a random acceleration waveform in comparison.
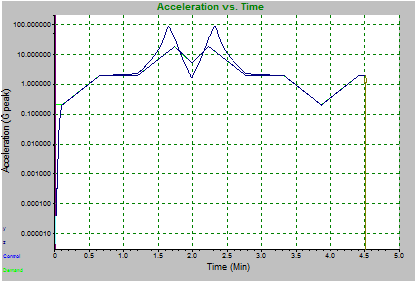
Time History – Acceleration, Velocity, Displacement, Frequency
The time history graph displays a time history of the test profile. Typically, engineers use it to observe changes due to dwelling at resonance. This is determined by observing the changes in acceleration over time.
Using the Data
Engineers analyze data after testing, the method depending on the test goal(s).
If the goal of a test is to minimize resonances at various frequencies and the test results show high resonances at a particular frequency, then the product must be redesigned to reduce the resonance. VibrationVIEW can automatically generate reports to display measurements and graphs related to the test profile.
Special Features
VibrationVIEW has many features and capabilities. This syllabus has covered several of them, but much of the software’s capability is still to be discovered.
The Vibration Research sales and support team routinely creates new tech talks and training videos, all of which are available in the library.
Introductory videos include: