Determine Operating Baseline
March 29, 2018
Back to: Preventative Maintenance
The quality of a vibration test depends on the reliability of the shaker system. Collecting baseline operating measurements upon the delivery of your shaker system is a good preventative maintenance practice. Then, you can run future tests on a routine schedule and compare the results. This process will ensure the system is performing according to standard.
A test engineer should be confident that their test results reflect the vibrations of the product and not a mechanical testing component. A change in levels over time can point to a potential problem in the system, such as a failing testing component. Any issues should be investigated and repaired/replaced to maintain the integrity of the test results.
Tests to Determine the Operating Baseline of a Shaker System
Several tests can be used to determine the operating baseline of a shaker system, including:
- Sine sweep with THD+N (recommended)
- Random
- Held sine tones
- Signal generator and oscilloscope or signal analyzer
(Click on any of the options to jump to more information.)
Taking System Configurations into Account
Test engineers should understand the mechanics of each system component and how they might impact the outcome of a test. They can use baseline operating tests to collect information to do so.
The following baseline operating tests should be run in several system configurations. First, run a baseline test with a bare table only and collect the measurements. Then, affix one component to the testing system (such as a head expander, fixture, etc.) and run a new test. Again, add another component to the system and run a test. Continue this process until you have added all the components to the system and recorded the measurements for each test.
Test engineers can determine how each component affects the system’s overall energy by observing its response after each addition. They can then compare the energy contribution of the system components to the overall product.
You should use the initial recordings from each system configuration as a benchmark and compare them to future recordings. The physical setup of the system should be identical for all tests to ensure the comparisons are accurate. When an individual component affects a system, you can identify it by running a baseline operating test in each system configuration and comparing the energy measurements.
Sine Sweep with THD+N (Recommended)
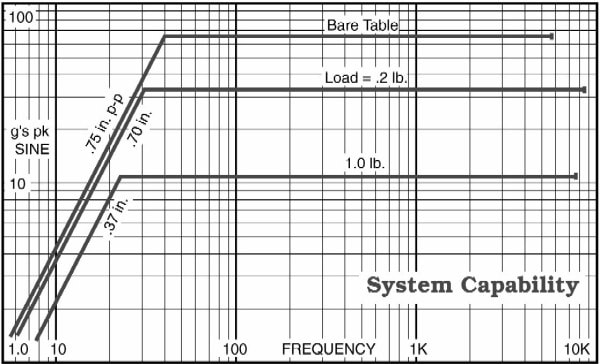
Figure 1. The system capability rating for a shaker manufacturer.
We recommend a sine sweep with total harmonic distortion (THD) for shaker validation. Many shaker manufacturers rate their systems according to a sinusoidal vibration peak force test (see Figure 1.) Therefore, a sine sweep test can also be run for shaker acceptance.
Additionally, a sinusoidal test sweeps through a range of frequencies using tracking filters and can accurately determine the vibrations across the frequency range of the shaker’s capability (see Figure 2.)
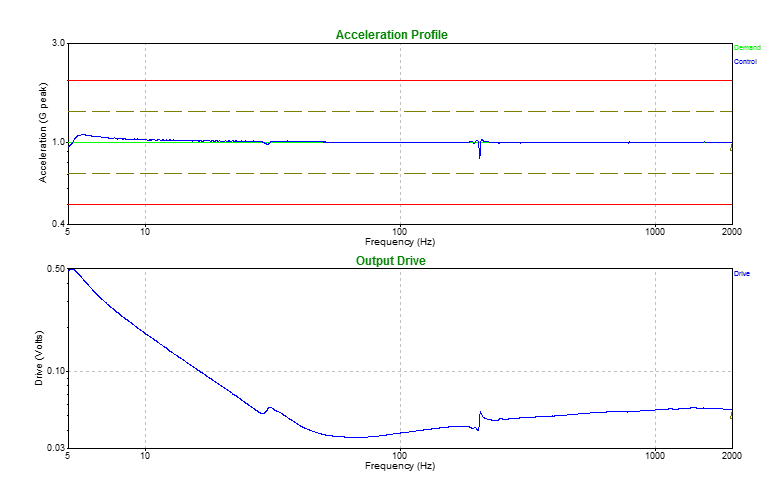
Figure 2. Sine sweep from 5Hz to 2000Hz showing the response signal and the drive voltage required to control the test. Snapshots like this can be recorded to monitor changes over time.
THD displays the harmonic content in a signal at each frequency. The more harmonic content, the larger the percent-THD value. A high value indicates noise or undesired vibration in the signal. As the mechanical components of the shaker degrade over time, more noise will be introduced into the system, and the percent-THD value will increase. THD+N displays the harmonic content plus the noise floor of the signal.
How to Run a Sine Sweep with THD+N
- Prepare for a bare-table test.
- Configure a sine sweep to cover the full frequency range of the shaker. If you are unsure, 5Hz to 2,000Hz is a good place to start. Make sure you are not exceeding the shaker ratings.
- Make sure the tracking filters are on. This will help to eliminate harmonic data and obtain a more accurate measurement.
- Run the test.
- Record the control (acceleration vs. frequency) signal.
- Record the drive output (drive vs. frequency) signal.
- Record the drive voltage minimum and maximum values during the sweep.
- Record the THD or THD+N.
- Add one mechanical component and repeat steps 1-8. Continue until all mechanical components have been affixed.
- Save the measurements for comparison against future recordings.
The output drive voltage will vary as the shaker degrades. When running the same test, you may see an increase in voltage requirement, new resonances being compensated for, or shifts/increases in the existing resonances. All are signs that the use of the shaker over time has caused degradation.
Running an Open-Loop Test
The same test can run open-loop without the controller from the response to verify that the controller is not interfering with the shaker and amplifier measurements. This is accomplished by sending a fixed voltage to the shaker and ignoring the response, as displayed in Figure 3.
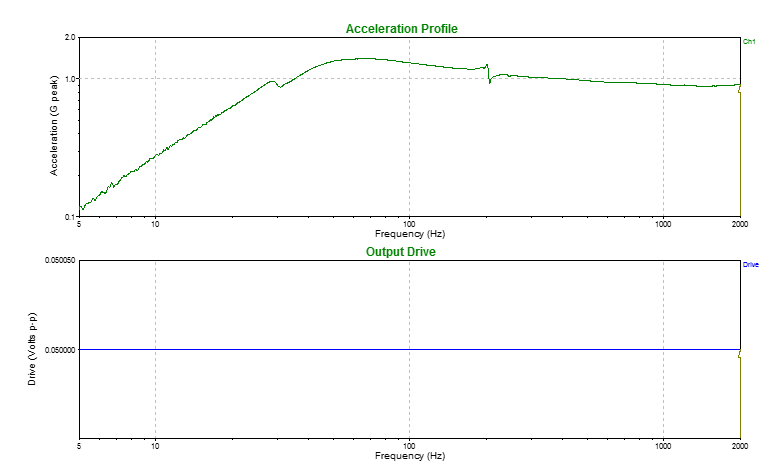
Figure 3. Open-loop sine sweep from 5 to 2000 Hz. Note the flat drive signal at 50 mV.
The closed-loop and open-loop data are essentially the same. Figure 4 is an overlay of the control and drive signals from both. The open-loop response is almost a perfect inversion of the closed-loop drive.
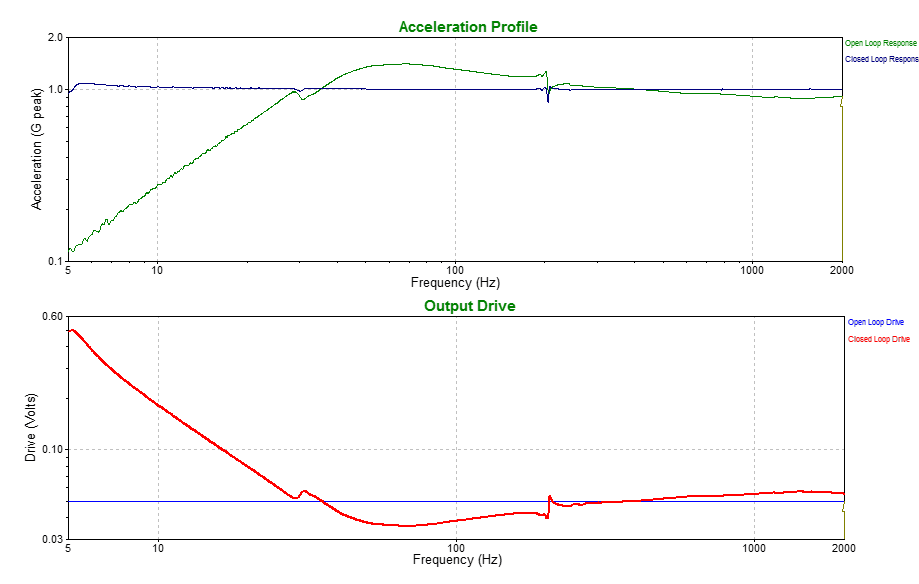
Figure 4. An overlay of closed-loop and open-loop test results. The closed-loop drive (bottom-red) is an almost perfect inversion of the open-loop response (top-green).
Random
Random tests and sine sweeps display the response of the shaker across the operating frequency range. However, a random test is not as accurate as a sine sweep because it does not display the actual response of the system; it displays an average response of the system. Instead of G vs. frequency, a random test displays energy density vs. frequency.
How to Run a Random Test
- Prepare for a bare-table test.
- Create either a standard random profile, such as the popular NAVMAT profile, or a flat random test (e.g. 0.001 G2/Hz from 10 to 4,000Hz). If there is a standard profile within the laboratory, it may be desirable to run the baseline measurement with the standard profile. Otherwise, a flat acceleration band across the frequency range is usually a better option.
- Run the test.
- Record the voltage density (drive output vs. frequency).
- Record the PSD (response acceleration vs. frequency).
- Add one mechanical component and repeat steps 1-5. Continue until all mechanical components have been affixed.
- Save the measurements for comparison against future recordings.
Held Sine Tones
The held sine tones baseline method is simple and provides the shaker response data for individual frequencies. This test can be run for several frequencies in each system configuration.
How to Hold Sine Tones
- Prepare for a bare-table test.
- Run a sine tone on the shaker. For an Electrodynamic shaker, the 30Hz range is a good place to start. This range is usually outside of the system resonance and has a low enough frequency to produce a measurable displacement. For a Hydraulic shaker, the 2Hz to 10Hz range is fitting.
- Note the amplitude and gain settings.
- Run the test.
- Record the input signal.
- Verify the displacement setting with a displacement wedge or other tool. We typically use a 0.1″, 30Hz sine dwell along with a displacement wedge on an Electrodynamic shaker. As the frequency increases, the displacement will become more difficult to physically measure, so it is impractical to verify displacement at every frequency.
- Repeat steps 1-5 for various frequencies at 1/3 octave steps to obtain several data points across the operating frequency range of the shaker system.
- Add one mechanical component and repeat steps 1-7. Continue until all mechanical components have been affixed.
- Save the measurements for comparison against future recordings.
Signal Generator and Oscilloscope or Spectrum (Signal) Analyzer
This method is similar to the Held Sine Tones method, but independent equipment is used instead of a controller. This test can be run for several frequencies in each system configuration.
How to Run a Signal Generator
- Connect a signal generator to the amplifier.
- Connect the (response) accelerometer to a signal analyzer or oscilloscope.
- Follow steps 1 through 9 of the Held Sine Tones method above.