Confidence Intervals
March 29, 2018
Getting Started
Power Spectral Density
Converting Recorded Data
Statistics & Probabilities
Test Control
Back to: Random Testing
When calculating the point estimate of a random variable—such as the mean value—it is possible to determine the probable error for the estimate. We can accomplish this by evaluating the confidence interval associated with the confidence level of the estimate.
The confidence interval and the confidence level work together. A higher confidence level requires a wider interval. Similarly, a lower confidence level results in a narrower interval.
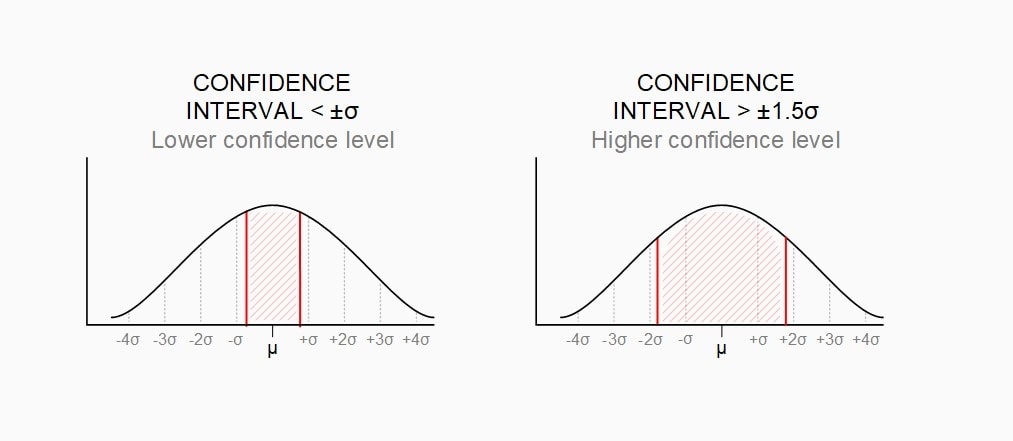
Example confidence interval values. The interval value on the left is <±σ; on the right, >±1.5σ. The confidence level for the interval on the left is lower than the confidence level for the interval on the right.
Calculating a Confidence Interval
When summing independent random variables, we must sum the mean values and variances. For example, when summing independent random variables A and B:
(1) 
Equation 12
(2) ![\begin{align*} \sigma_{A+B}^2=\frac{1}{N}\sum(A-\mu_{A}+B-\mu_{B})^2\\ =\frac{1}{N}\sum[(A-\mu_{A})^2+2(A-\mu_{A})(B-\mu_{B})+(B-\mu_{B})^2]\\ =\sigma_{A}^2+0+\sigma_{B}^2 \end{align*}](https://vru.vibrationresearch.com/wp-content/ql-cache/quicklatex.com-00bb336e144882f125a13ed792a79634_l3.png "Rendered by QuickLaTeX.com")
Equation 13
Equation 13 can determine the standard deviation of the mean value (x) computed from N random variables (x) with a known standard deviation (sx). The sum of x will have a variance of Nsx2 and a standard deviation of  . Dividing the value by N to compute the standard deviation of x results in Equation 14.
(3) 
Equation 14
Confidence Level
Equation 14 can determine the confidence interval of an estimated mean value assuming x is normally distributed. The confidence interval depends on the probability, or confidence level, of the interval. It is determined by the probability of the value being within a certain number of standard deviations (σ x) from the true mean (μ). The area P in the graph below represents the confidence level.
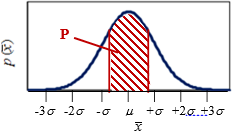
In Figure 3.12, the confidence level is a function of z, which is the number of standard deviations from the true mean. Therefore, a confidence interval of ±σ x has a confidence level of 68%. The 95% confidence interval is ±2σ x, the 99.7% confidence interval is ±3σ x, etc. Note from Equation 14 that →σ x as N→∞.
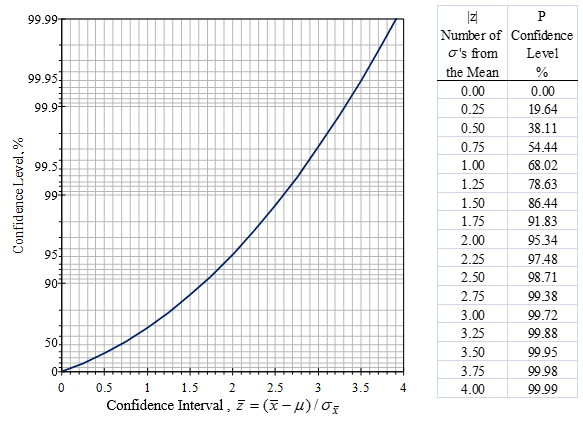
Figure 3.12. Confidence levels vs. confidence intervals for the estimated mean value.
The normal distribution is almost always assumed for the mean value estimation because of the central limit theorem. If we use the example of a mean value calculated from an average of four values, the standard deviation of the uniform distribution (-0.5, 0.5) is 0.144. Assuming a normal distribution, the 95% confidence interval would be ±0.288. In reality, the 95% confidence interval is 0.24.
T-Distribution
Determining the confidence interval is more complicated for mean and standard deviation values from a small data sample. In such cases, it is common to use t-distribution. T-distribution provides larger confidence intervals for the same confidence level due to increased uncertainty in the sample distribution.
For N > 3 samples, the variance of the sample mean is increased by a ratio of (N – 1) / (N – 3) compared to Equation 13. Figure 3.13 shows the modified number (tvalue) of standard deviations σ x to calculate the confidence interval for different confidence levels as a function of the number of samples. Equation 15 provides the estimate for the true mean.
(4) 
Equation 15
For N > 50, the t-distribution converges to the normal distribution, and Figure 3.13 is a valid option.
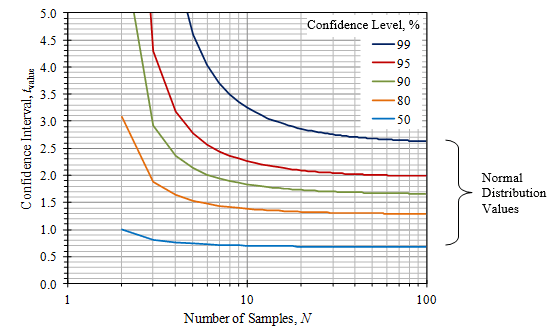
Figure 3.13. Confidence intervals using the t-distribution for small sample sizes.
The statement of the confidence interval often omits the confidence level. In many cases, a confidence level of 95% is assumed and a confidence interval of approximately ± 2σ is used. This is true in many opinion polls when a plus/minus percent margin of error is appended to the percentage results given. In surveys with N respondents, the standard deviation is assumed to be σ = 0.5/N1/2, so a margin of error of ± 4% (with a confidence level of 95%) simply means that approximately N = 1/(0.04)2 = 625 people were surveyed (4% = 0.04 = 2σ = 1/ N1/2).