Chi-Squared Distribution
March 29, 2018
Getting Started
Power Spectral Density
Converting Recorded Data
Statistics & Probabilities
Test Control
Back to: Random Testing
Chi-squared ( ) distribution is the distribution of a sum of squared random variables. Among other applications, it can estimate the confidence interval for the variance of a random variable from a normal distribution.
A chi-squared distribution with N degrees of freedom ( ) determines the probability of a normal distribution where the mean value (
 ) equals 0 and variance (
 ) equals 1.
Figure 3.14 is an example of the probability density function (PDF) for different values of N. As N approaches infinity, the distribution converges with the normal distribution. For all the distributions, the mean value is μ = N, and the variance is σ2 = 2.
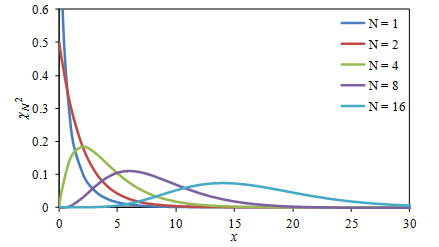
Figure 3.14. distribution for the sum of N values of x2.
Equation 16 is the PDF formula, where Γ is the Gamma function.
(1) 
Equation 16
The squared values that evaluate the mean-square are  distributed. Figure 3.15 illustrates this using the car vibration signal in Figure 3.2. The distribution is strongly biased toward small values as shown by the simplified formula for (Equation 17).
(2) 
Equation 17
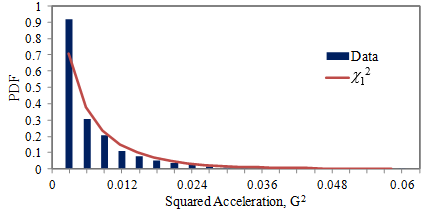
Figure 3.15. PDF of squared car vibration data from Figure 3.2 compared to .
Confidence Intervals
Variance is derived from the mean-square value. Therefore, distribution can determine the confidence interval for the variance.
For a random variable x with a standard deviation of σx, the summation of N values-squared has a σx2χ12 distribution. Therefore, the variance has a σx2χ12/N distribution.
The distributions are not symmetrical, so the estimated confidence intervals for the variance are not symmetrical. In Figure 3.16, the values of  are on a plot versus N for different confidence levels. The confidence interval for the variance is then stated as the interval:
(3) 
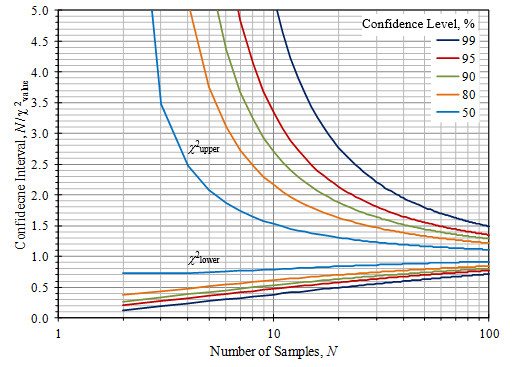
Figure 3.16. Confidence intervals using the distribution for small sample sizes.
For N > 100, we can use the normal distribution. The standard deviation of the variance estimate is √2/N σx2, and we can use the (symmetrical) confidence intervals from Figure 3.13.