Acceleration Parameters for FDS
February 23, 2021
Analyzing Waveforms
Reproducing Waveforms
Fatigue Damage Spectrum (FDS)
Sine-on-Random (SoR) Test Generation
Shock Response Spectrum (SRS)
Back to: Test Development with Recorded Data
Engineers can use the fatigue damage spectrum (FDS) to create an accelerated random PSD test profile that is the damage equivalent to the recorded environment. This process involves several test generation/acceleration parameters: the m value, resonance factor (Q), target life, and test duration.
Material Property and the S-N Curve
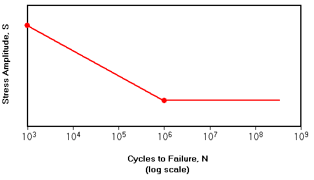
The S-N curve plots stress (S) versus the number of cycles to failure (N), generally on a logarithmic scale. S-N curves are specific to component material (such as aluminum, plastics, etc.), and test programs typically reference one S-N curve for FDS-correlated test generation.
The m value (m = -1/b) is calculated from the slope of the S-N curve (b). The FDS calculation applies the m and Q values to calculate the fatigue damage values that make up the FDS. Engineers can use general values for m and Q, but also determine more precise values.
The m Value
The m value is, in most cases, some proportion of the negative reciprocal of the S-N slope (-1/b). According to MIL-STD-810H, the m value is normally “80 percent of ‘-1/b’ for random waveshapes, and 60 percent of ‘-1/b’ for sinusoidal waveshapes” [1]. A value between 5 and 8 is common.
A more specific m value can be found by generating an estimate of the S-N curve for the test component. To do so, the engineer should test the component at different gRMS levels to failure and record the time required to reach failure. An approximation of the S-N curve can be back-calculated by plotting the data points on a log-log graph and then plotting the power-law model of the data. The slope of the power-law model is equal to b. The m value can be calculated from the negative reciprocal of the slope (-1/b).
FDS uses a stress-strain curve to determine test acceleration. Therefore, the accuracy of the m value determines the accuracy of the test acceleration. The importance of the accuracy of m increases as more acceleration is applied to the test.
Vibration Research created a free material property calculator that plots the gRMS waveform to failure, determines the slope of the S-N curve, and calculates the m value based on the input data.
Consideration to Kurtosis
Real-world data are usually non-Gaussian. For non-Gaussian waveforms, a high m value gives more weight to high amplitude events than a lower m value. Thus, the high kurtosis peaks have more influence on the FDS calculation. The result is a test with higher acceleration, velocity, and displacement than the original environment—i.e., a more conservative test.
An appropriate kurtosis level can be applied to a test to generate peak accelerations that are similar to the real world. The addition of kurtosis does not increase the relative damage of the test. When kurtosis is added, the overall gRMS is decreased to ensure that the relative damage remains equivalent to the original data.
Resonance Quality Factor (Q)
The resonance quality factor (Q) determines the damping value of oscillation or the speed at which it decays. The Q value is equal to 0.5 divided by the critical damping ratio (ζ). A higher Q value will result in a lower rate of energy loss and slower decay of the oscillation. Conversely, a lower Q value will result in a higher rate of energy loss and faster decay of the oscillation.
The Q value for the FDS calculation should equal the Q value of the product’s sharpest resonance within the test frequency range. If the Q value of a product is not known, set the value to 10. A Q value of 10 can output an FDS-correlated PSD with reasonable filtering and frequency response.
To calculate a more exact Q value for the product, run a simple sine sweep through the operating range of the device under test to determine the primary resonance. From there, the Q value of the resonance can be calculated.
The Q value has less effect on the FDS calculation than the m value. A high Q value uses narrower filters, which results in sharper peaks. A low Q value results in a wider filter and a smoother spectrum but is less detailed.
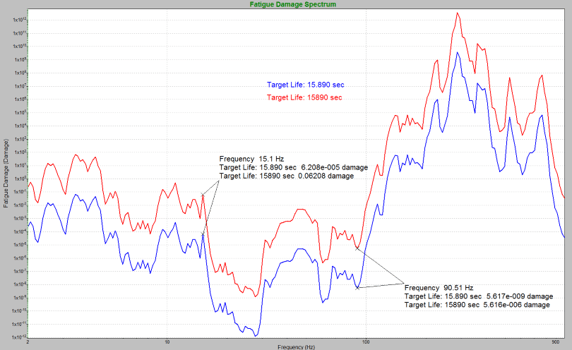
Target Life and Test Duration
The target life determines the amount of time or number of cycles the time-history files should be run to represent a lifetime of damage. The value could be the length of a product warranty or the length of time the product should last when exposed to the imported time-history files.
For multiple time-history files, the target life for the product is determined by weighing the individual time-history files by time or cycles. A target life value is assigned to each waveform to accomplish this.
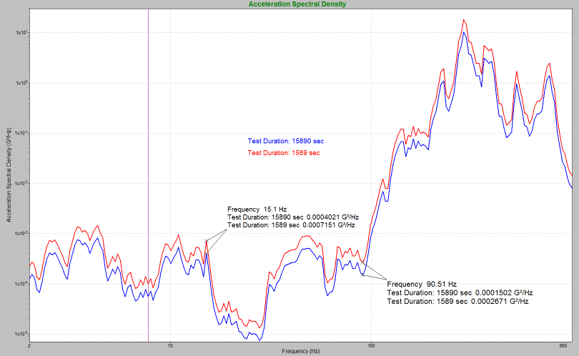
When setting a test duration, the goal should not be to run the test in the quickest time possible. Less acceleration equates to a more accurate reflection of the true environment. In MIL-STD-810H, the following is advised:
“Provided that fatigue is a significant potential failure criterion for the materiel under test, this practice [test acceleration] is acceptable within strict limits, notably that test amplitudes are not over exaggerated (or accelerated) simply to achieve short test durations. Such excessive amplitudes may lead to wholly unrepresentative failures, and cause suppliers to design materiel to withstand arbitrary tests rather than the in-service conditions.”
Additionally, the instantaneous stress limit of the product should not be exceeded. MIL-STD-810H introduces the idea of an “exaggeration factor,” which should be “…kept to a minimum value consistent with the constraints of in-service time and desired time” [1].
Octave Spacing
In the FDS, octave spacing defines the interval between frequency bins. Essentially, the value determines the number of breakpoints generated for the random PSD and the number of single/narrow frequency waveforms analyzed in the FDS calculation. For example, a 1/3 octave will result in fewer breakpoints and a wider band of content in each analysis bin compared to a 1/12 octave.
Running the Test
The FDS-correlated PSD is the damage equivalent to the lifetime of the product based on the imported files, m and Q values, target life, test duration, and kurtosis. The resulting PSD can be used in many stages of vibration testing, from initial product development to re-creating field failures in a lab environment.