
Defining SRS Test Specifications
April 27, 2026
Introduction
Control & Analysis
Industry Applications
Back to: Shock Response Spectrum (SRS)
Many questions about shock response spectra (SRS) testing stem from a misunderstanding of the test specifications. This lesson will cover common errors and issues as well as provide tips for defining SRS requirements for closed-loop control.
SRS Test Specifications
More often than not, test specifications do not provide a complete definition of the SRS. While room for interpretation can be acceptable, ill-defined requirements force the engineer to make subjective decisions when synthesizing the waveform to meet the required response spectrum (RRS).
Parameters
Some SRS parameters, if undefined, can result in different tests. Test specifications can define the pulse duration, Te, peak amplitude, and peak velocity (with tolerances) to reduce the number of potential solutions to meet a desired SRS. By defining these parameters, test specifications force labs to generate a test that best reproduces the operational environment rather than one that is easiest to run.
SRS Defining Characteristics
- Breakpoint table
- Number of pulses
- Damping or Q
- Te (per MIL-STD-810H)
- TE (per MIL-STD-810H)
- Acceleration, velocity and/or displacement
Learn more: Te and TE Calculation for SRS Testing
Common Issues in Test Specifications
The SRS allows engineers to generalize a shock environment. A single pulse can be representative of a variety of impulses.
To begin, let’s review an SRS breakpoint table for a closed-loop shaker test. A basic SRS test specification includes a breakpoint table, a Q value (damping), and the number of pulses.
|
Frequency (Hz) |
Amplitude (Gpk) |
|
10 |
9.44194 |
|
80 |
75 |
|
2000 |
75 |
For the given breakpoint table and Q value, there are nearly an infinite number of potential solutions. The SRS synthesis types that meet this requirement can produce significantly different results on the shaker table.
The following graph shows several waveforms with different characteristics that can meet the demand. They have nearly identical SRS responses but range in acceleration, velocity, displacement, and duration.
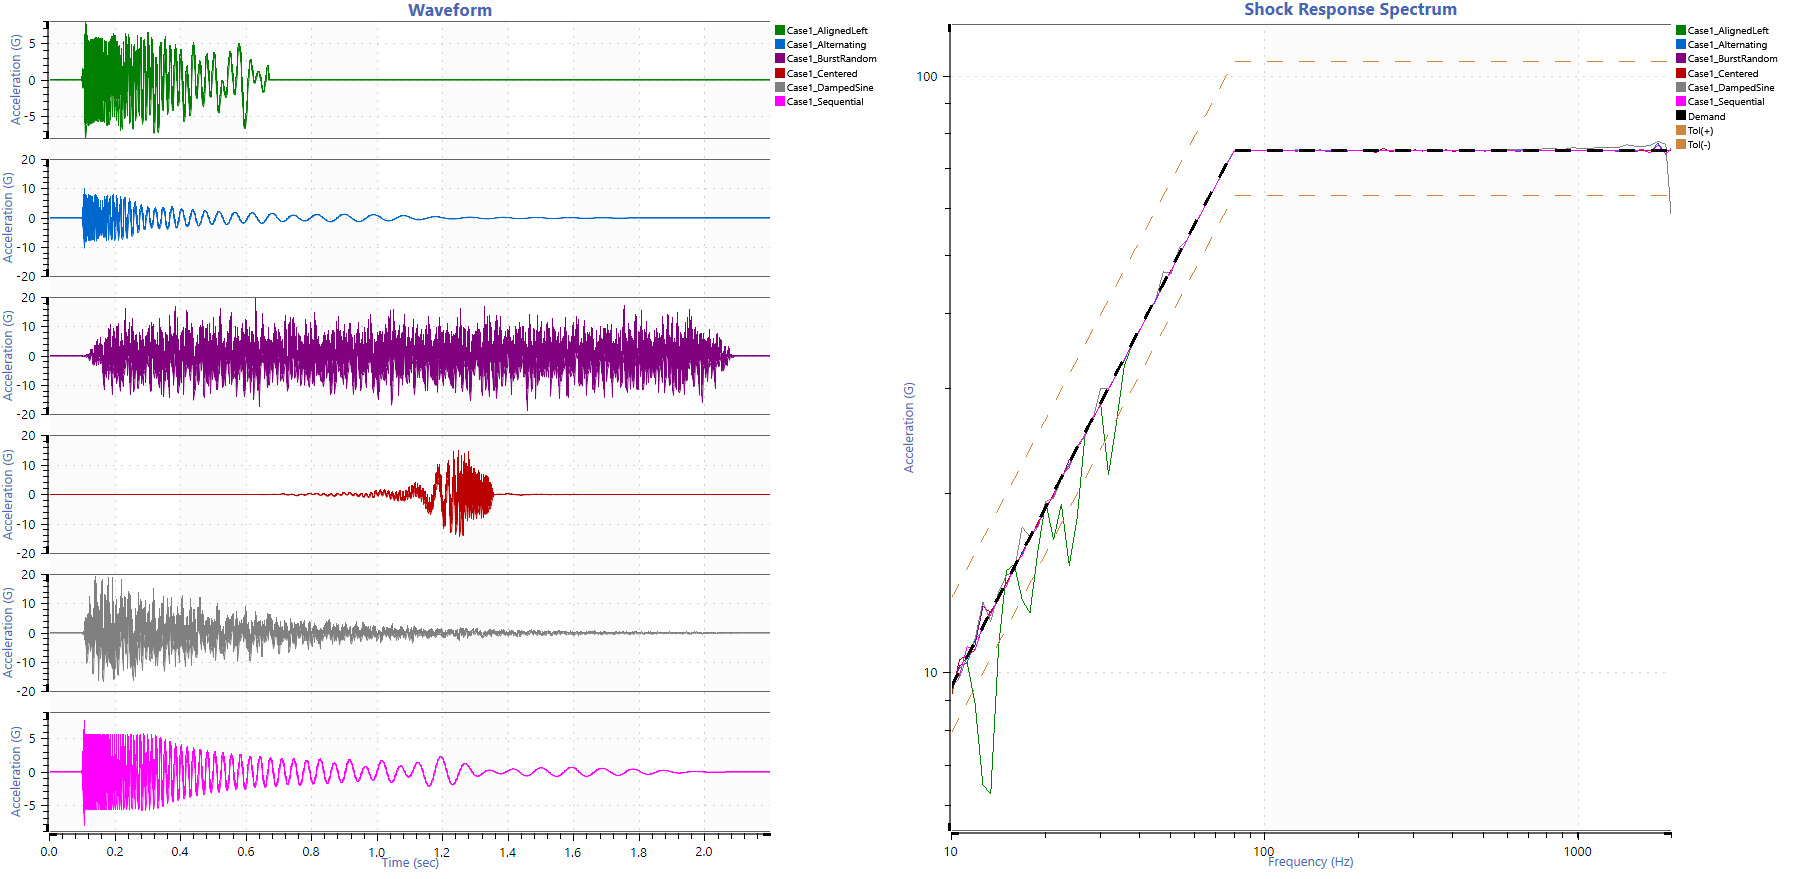
Case 1. Synthesized waveforms that meet the SRS test specification.
The provided specifications prompt the engineer to question which waveform to synthesize and which environment to model.
- Shortest or longest duration?
- Least severe (lowest A/V/D)?
- Most severe (highest delta-V)?
The more test parameters specified reduce the number of potential solutions. Engineers can evaluate the limitations of their SRS test given the information provided.
Additional Specifications
Let’s see what happens when we add a Te value, which MIL-STD-810 defines as the effective duration of the shock.
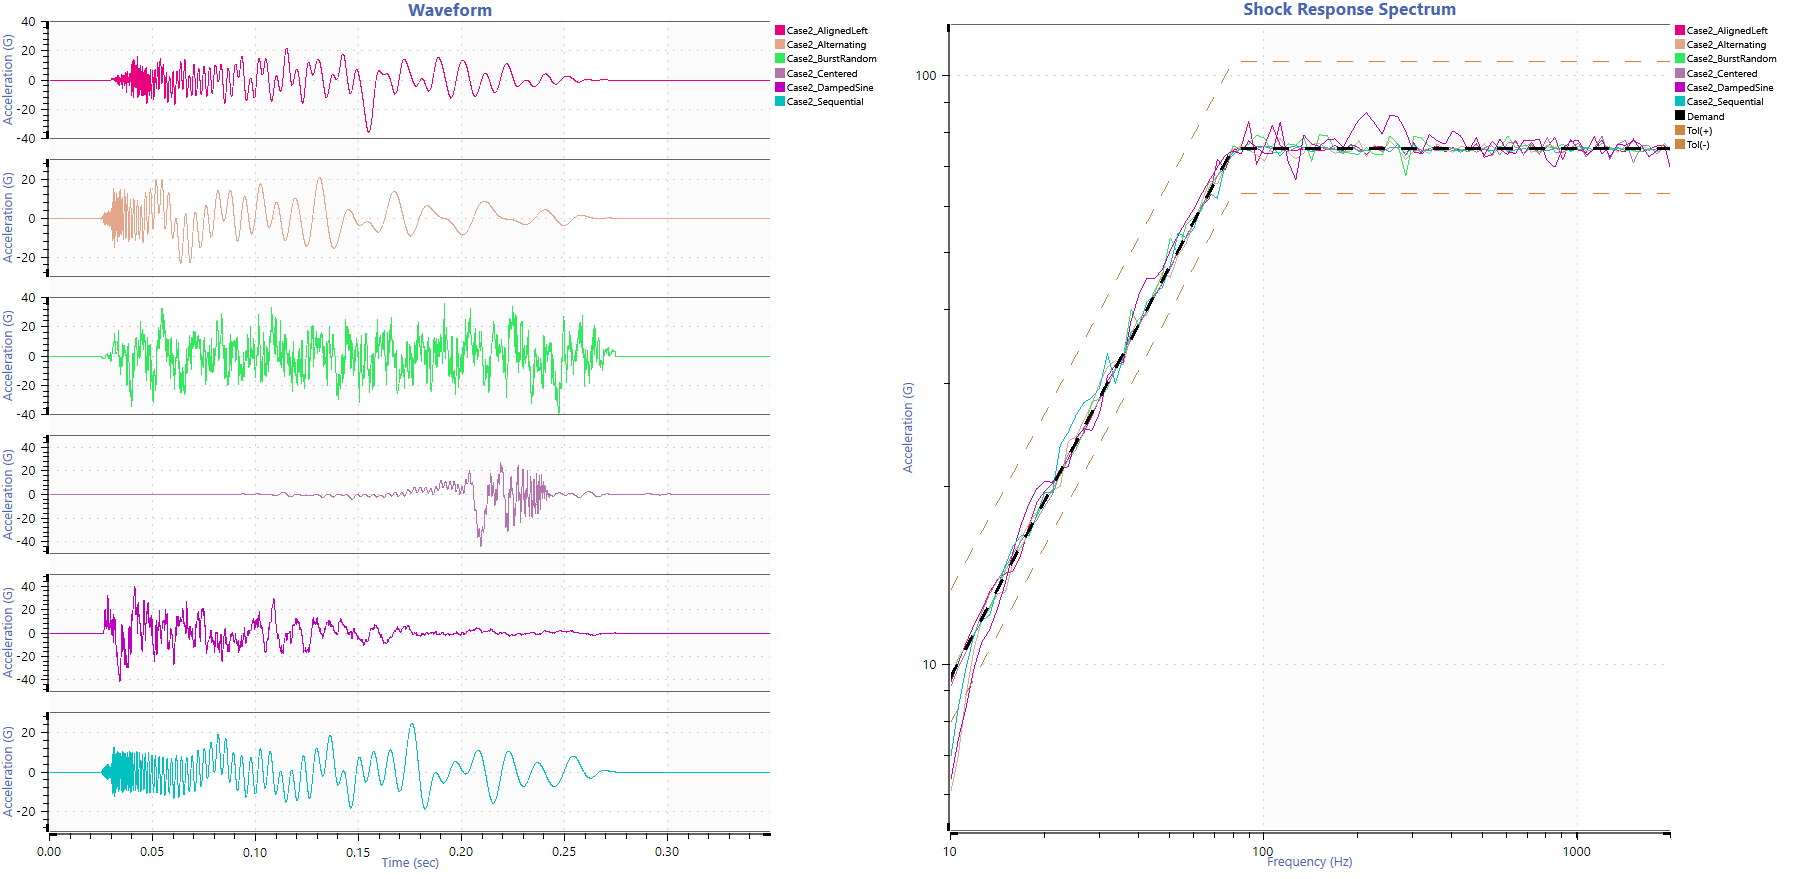
Case 2. Synthesized waveforms that meet the SRS test specification with a defined Te value.
The potential pulses are more similar in length, and all solutions meet the RRS. However, there is still a significant range of acceleration, velocity, and displacement values. How does the engineer know which severity to choose?
TE, another MIL-STD-810 value, helps shape the pulse duration. Adding a required TE value reduces the engineer’s selection to two waveforms, although more options are available if they can drop the lower frequencies.
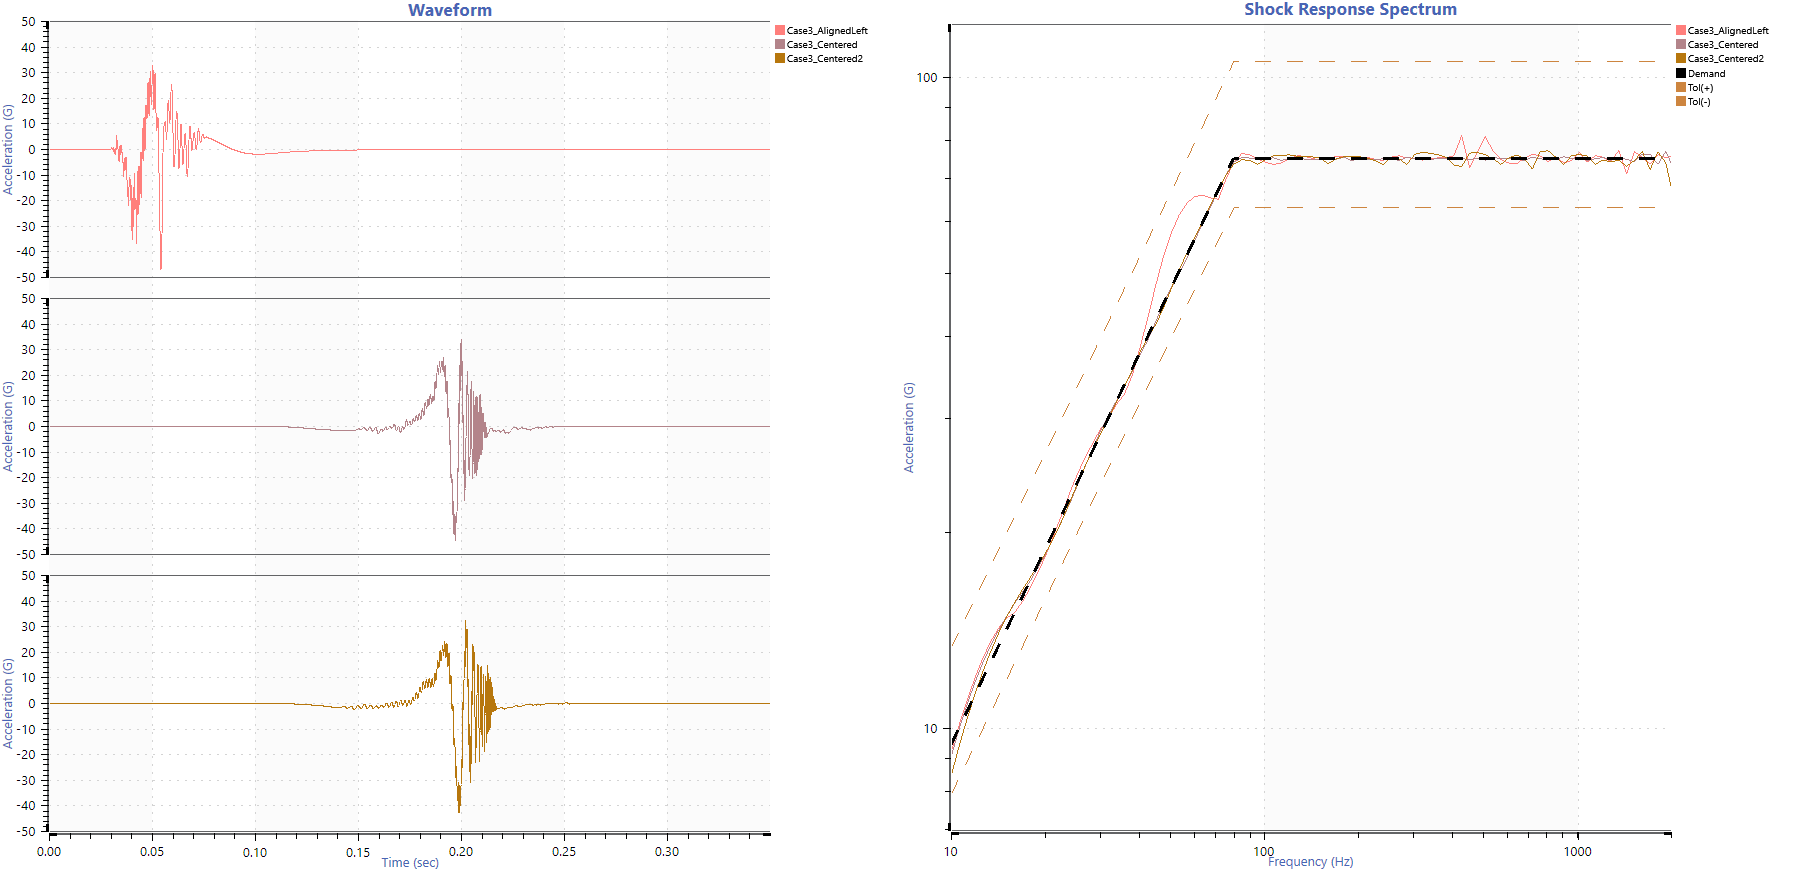
Case 3. Synthesized waveforms that meet the SRS test specification with defined Te and TE values.
If we add a zero-point acceleration (ZPA) and ± SRS tolerance requirement, we see that only the centered waveform can meet the tolerances in both the positive and negative spectra.
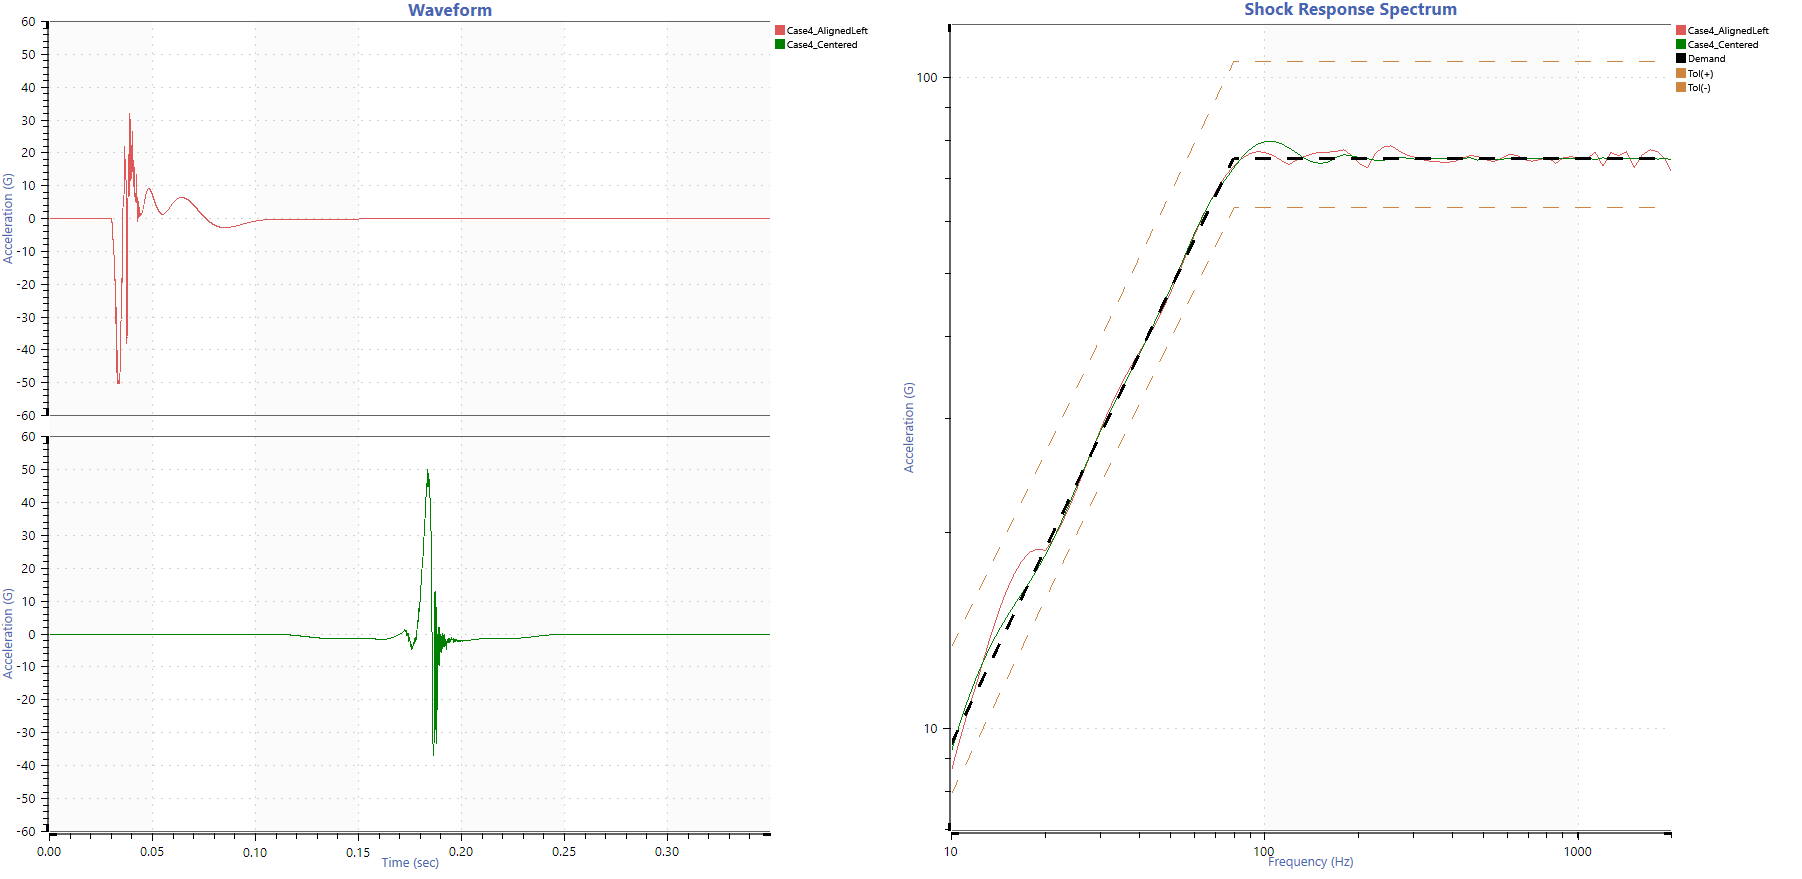
Case 4. Synthesized waveforms that meet the SRS test specification with defined Te and TE values and ZPA.
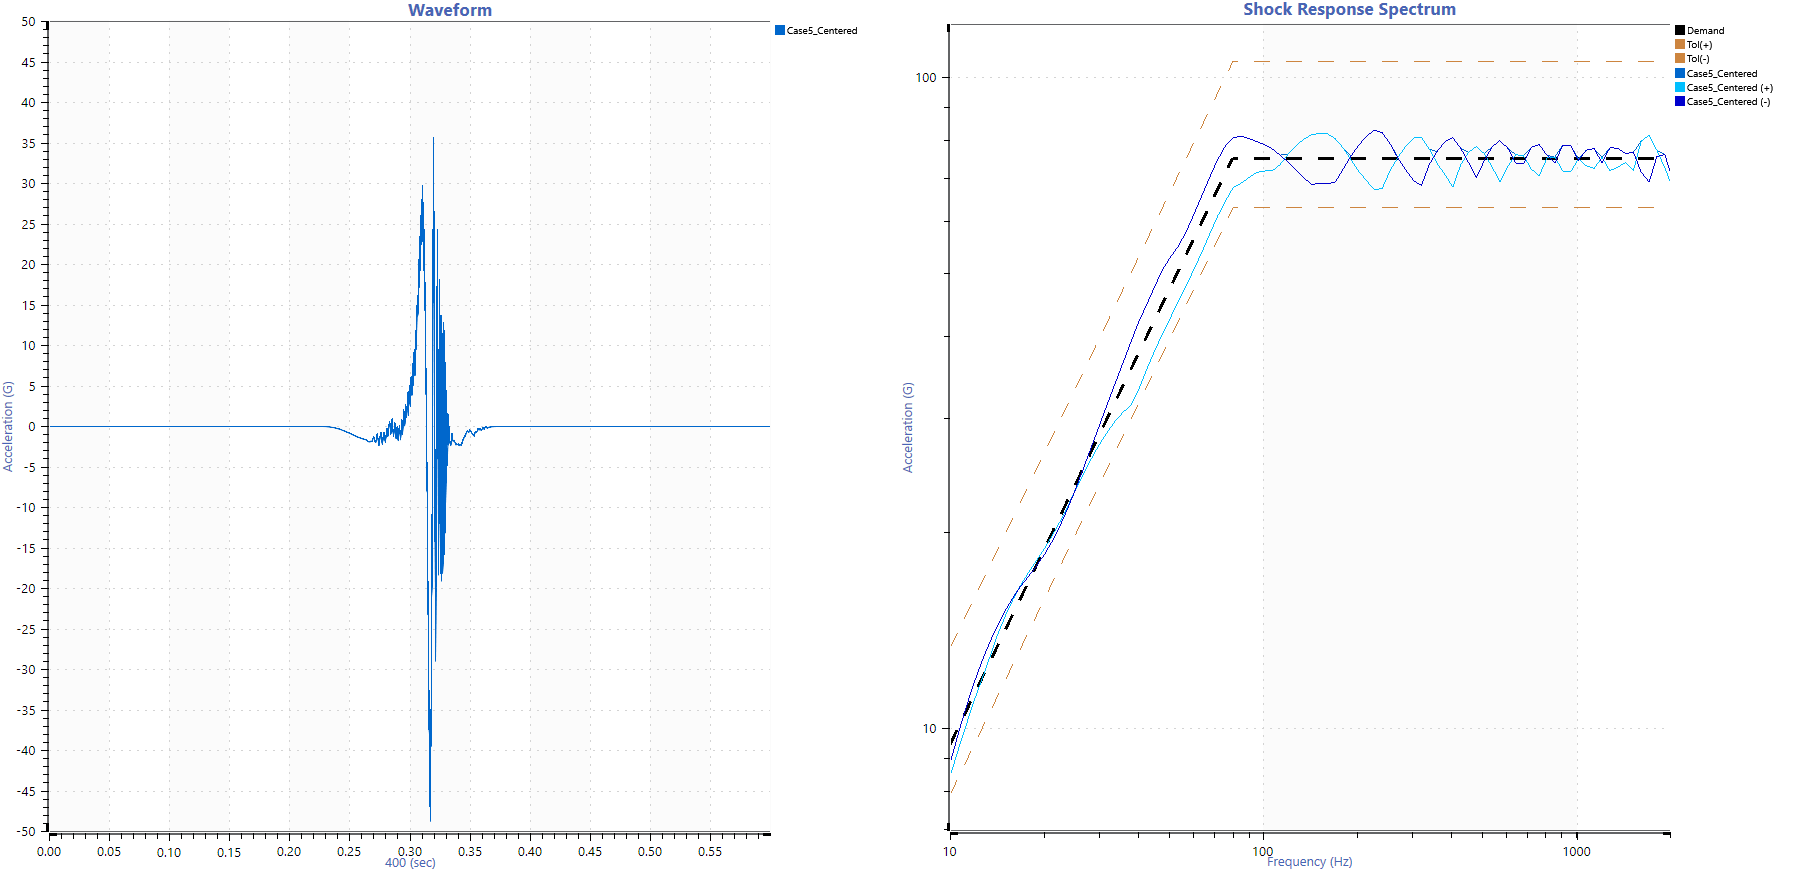
Case 5. Synthesized waveform that meets the SRS test specification with defined Te and TE values, ZPA, and ± tolerances.
Conclusion
SRS specifications can allow for some variation; the flexibility of this test option is a part of its appeal. However, poorly defined specifications can result in a variation of potential solutions, leading to inconsistency between tests and creating conflicts when determining if a test can be run.
The goal should be to replicate the operational environment, as both over- and under-testing can cause issues. The following video goes more in-depth into this discussion and provides an example of how to create a test specification from field data.