Shock Response Spectrum (SRS) Trace
June 27, 2022
Back to: Getting to Know ObserVIEW 2022.1
Shock response spectrum (SRS) plots are a new feature in ObserVIEW 2022.1. Similar to the FFT, the SRS represents time data in the frequency domain. The filters that the SRS applies to the time-data plot show the magnitude of the peak response for each filter applied to the time data over its frequency range.
Example
Comparing the Potential Damage of a Shock Pulse
Goal: To measure and compare the damage of a single shock pulse versus the potential damage of multiple occurrences.
Software: ObserVIEW
Required licenses: SRS, FDS
Analysis
A single shock pulse waveform (R:SinglePulse.vfw) was generated by striking a modal hammer against a test object, and an accelerometer recorded the response (Ch4(Z)).
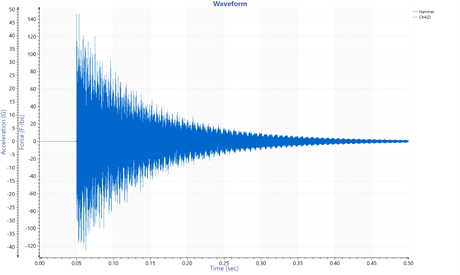
A single shock pulse waveform.
The following FFT displays the event’s frequency data. The highest amplitude frequencies are near 2,233Hz.
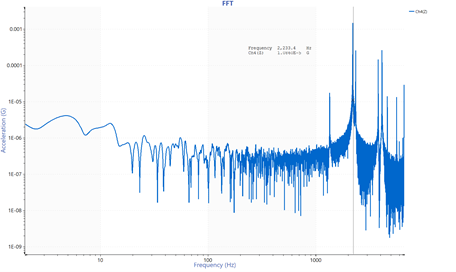
FFT plot of the single shock pulse.
The SRS of the shock pulse shows that the peak acceleration lines up with the peak frequency values in the FFT. However, the peak acceleration for this frequency bin is just over 1,000G.
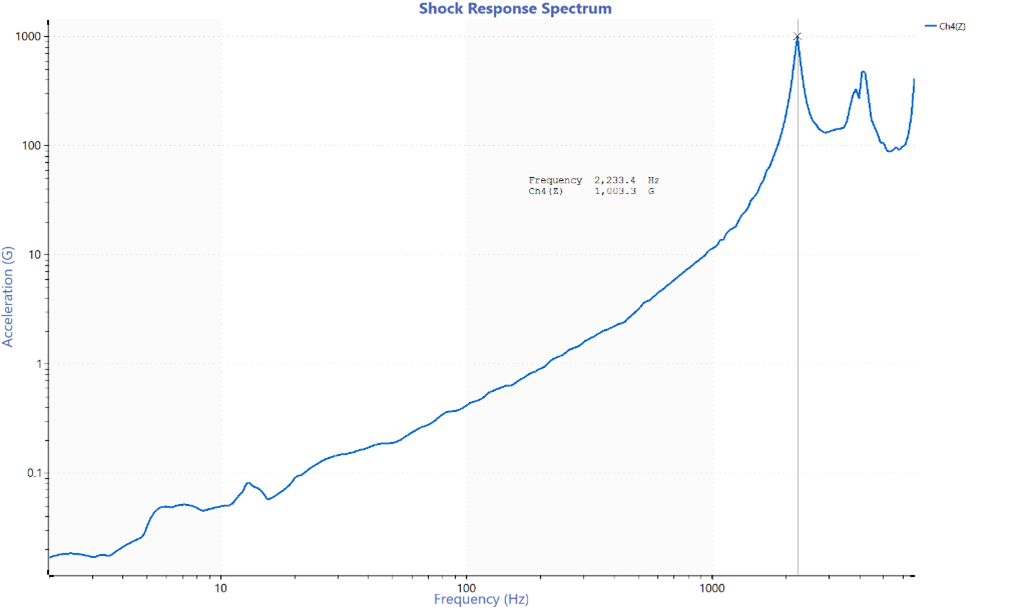
An SRS plot of the single shock pulse.
The peak acceleration gives insight into the potential damage of the shock pulse. Using the fatigue damage spectrum (FDS) plot (another new feature in ObserVIEW 2022.1), we can measure and compare the damage of the shock pulse alone versus the potential damage of multiple occurrences.
The following FDS plot shows that the potential damage for the peak acceleration value is relatively low.
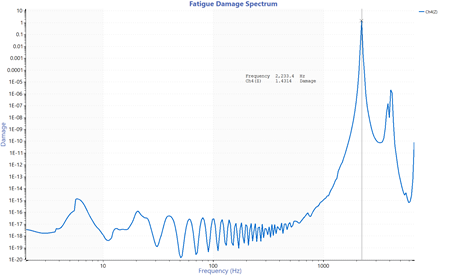
An FDS plot of the single shock pulse.
Next, we analyzed a waveform with the same shock pulse repeated multiple times (R:MultiplePulses.vfw).
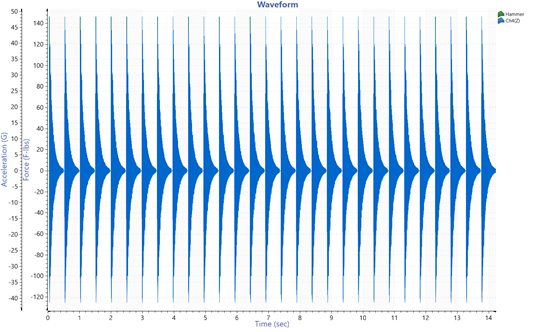
A waveform with the shock pulse repeated multiple times.
The SRS over the waveform range shows that the peak acceleration values are the same as the single shock pulse. The SRS displays the peak acceleration, and our peak amplitude does not increase with each additional shock pulse.
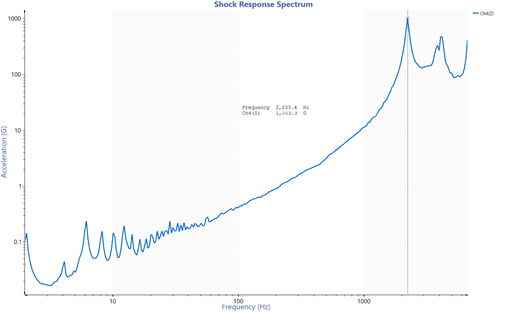
An SRS plot of the shock pulse repeated multiple times.
The difference in potential damage was most visible in the FDS plot. The peak damage value for the waveform occurred at the same frequency as the single shock pulse, but the overall potential damage for the multiple pulses was much higher than the single pulse.
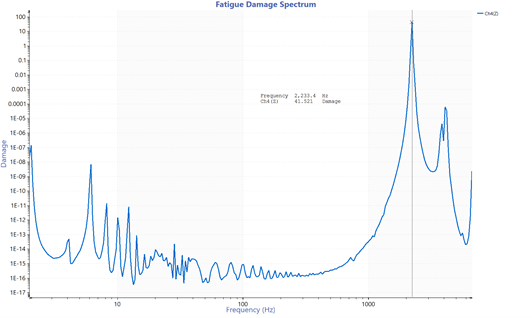
An FDS plot of the shock pulse repeated multiple times.
The single-shock pulse alone was not very damaging, but repeating the shock pulse multiple times caused much higher damage.