Rayleigh Distribution
March 29, 2018
Getting Started
Power Spectral Density
Converting Recorded Data
Statistics & Probabilities
Test Control
Back to: Random Testing
There are several situations where Rayleigh distribution occurs in random vibration. The peak amplitudes of a resonance‘s response to a random excitation exhibit a Rayleigh distribution. The amplitudes of the spatial vibration patterns in complex systems also have a Rayleigh distribution.
The second example led John W. Strutt to derive the formula for the Rayleigh probability distribution. He considered the vibration amplitude to be a vector r with a and b components that are independent and normally distributed with a zero mean value and variance, σo 2.
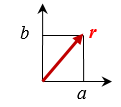
Equation 23 gives the normalized magnitude of r.
(1) 
Equation 23
Equation 24 gives the PDF, which is displayed in Figure 3.19.
(2) 
Equation 24
The Rayleigh PDF is not symmetrical, and the mean value is not equal to 1. Instead, r ≅ 1.25 σo and σr ≅ 0.655 σo.
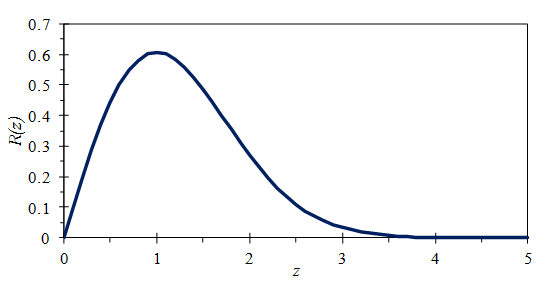
Figure 3.19. The Rayleigh distribution.
Example
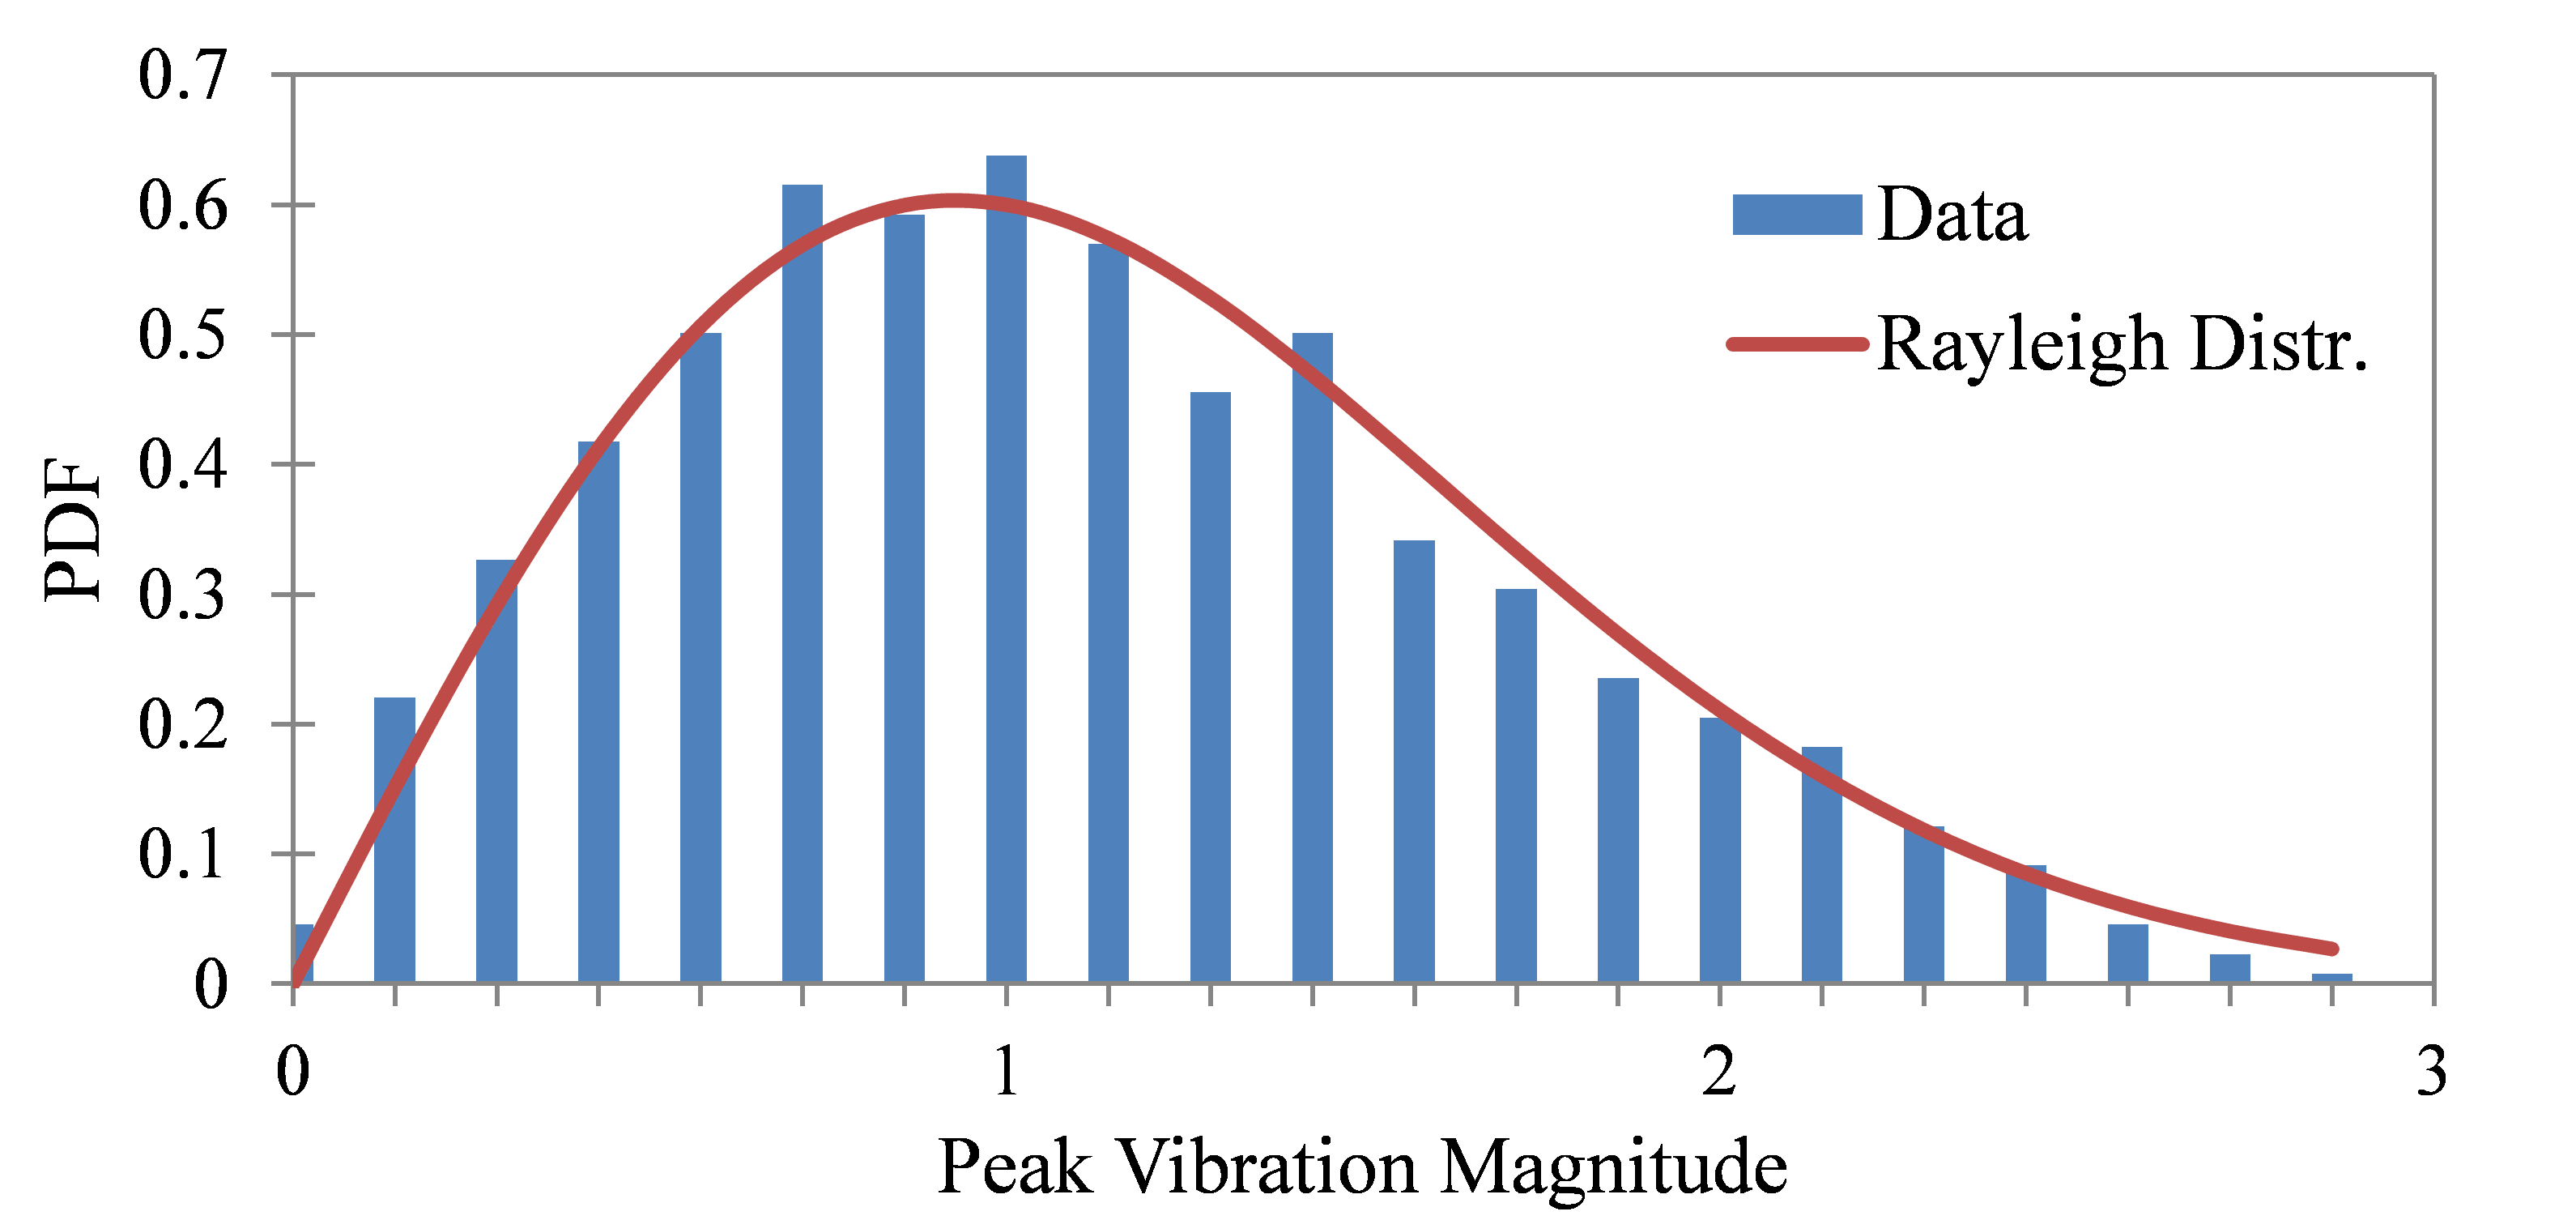
Figure 3.20 displays the vibration response of a cantilever beam’s resonance to random excitation at the base. Figure 3.21 compares the histogram of the peak magnitudes, |Ai|, to the Rayleigh distribution. The peak magnitudes are proportional to the peak stresses in the beam. Application-wise, engineers can use the results in fatigue analysis.
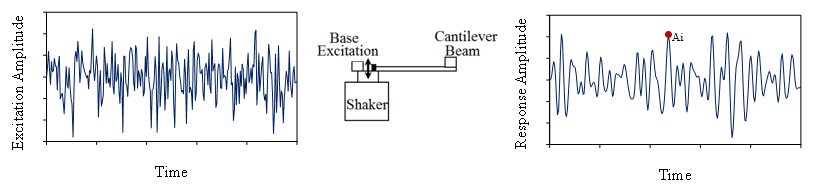
Figure 3.20. Random vibration response of the fundamental resonance of a cantilever beam.
Confidence Intervals
The Rayleigh distribution has a close association with the χ22 distribution because the Rayleigh variables are the square root of the χ22 variables.
(3) 
The area P in the graph below displays the confidence level “not to be exceeded” for the peak level estimation. Figure 3.22 is a plot as a function of the number of standard deviations from the mean.
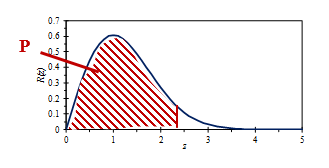
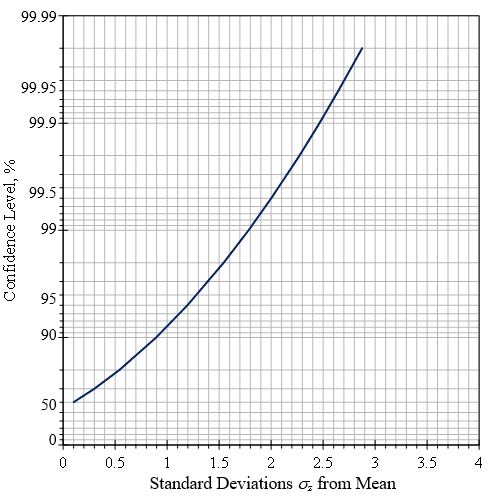
Figure 3.22. Confidence intervals for “not to exceed levels” with Rayleigh distribution.