Data Analysis
June 2, 2021
Process Data
Analyze Data
System Identification
Mathematical Foundations
Back to: Fundamentals of Signal Processing
ObserVIEW is software for analyzing time waveform data. Common analysis operations and relevant topics include:
- Sampling
- Fast Fourier transform (FFT)
- Statistical analysis
- Autocorrelation
- Cross-correlation
- Auto spectral density (ASD / PSD)
- Cross spectral density (CSD)
Taking Data Apart (Analysis)
The English word analysis comes from the Greek word ἀvάλυσις, which means to separate something into parts. There is an unlimited number of analysis methods, including:
- Sampling: taking data apart into samples
- Fourier analysis: taking data apart into sinusoids
- Wavelet analysis: taking data apart into wavelets
- Statistical analysis: taking data apart into statistical properties
Putting Data Back Together (Synthesis)
After taking something apart with an analysis, engineers often want to put it back together by approximation or perfectly put it back together by synthesis.
Reconstruction is the operation of putting analyzed components back together.
Is true synthesis (i.e., perfect reconstruction) possible? The answer is yes, but only if you have an ideal low-pass filter. An almost ideal filter will result in an almost perfect synthesis.
Alternate Domains
Acquisition devices collect data in the time domain, and engineers can analyze it in that domain. However, it is often more convenient to use a mathematical transform to project data into a different domain for analysis. Patterns that were not clear in the time domain can become readily apparent in another.
The frequency domain is the most common alternate domain in engineering applications. For continuous data, engineers use the Fourier transform to project data into this domain.
For discrete-time data, projection is achieved using the discrete-time Fourier transform, the discrete Fourier transform (DFT), or the fast Fourier transform (FFT). Discrete-time data is digital data collected with the assistance of an analog-to-digital converter (ADC).
Bases
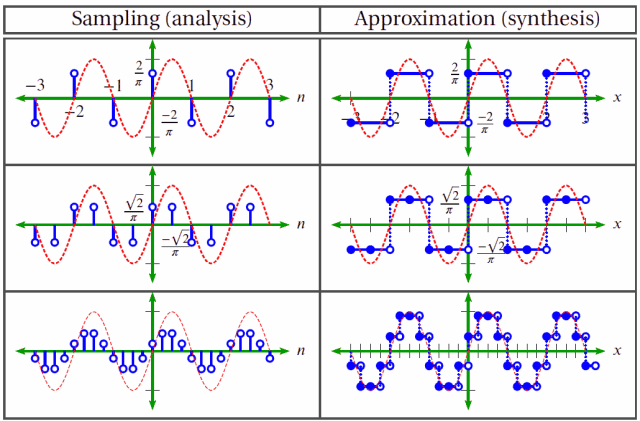
Every domain is built on a foundation called a basis or, more generally, a frame. For example, in the frequency domain, the basis is made up of sine and cosine waveforms. Data in each domain can then be analyzed into components by projecting the data onto these waveforms.
The set of these components for a given waveform is generally called a transform. Examples of transforms include the Fourier transform, the FFT, the DFT, cosine polynomials, Chebyshev polynomials, and any of the many wavelet transforms.
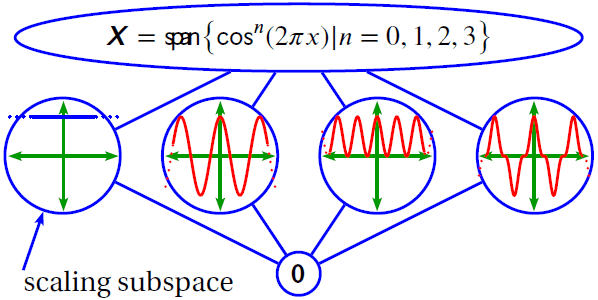
Cosine polynomials.
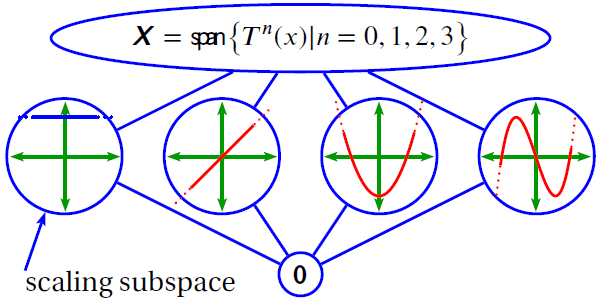
Chebyshev polynomials.
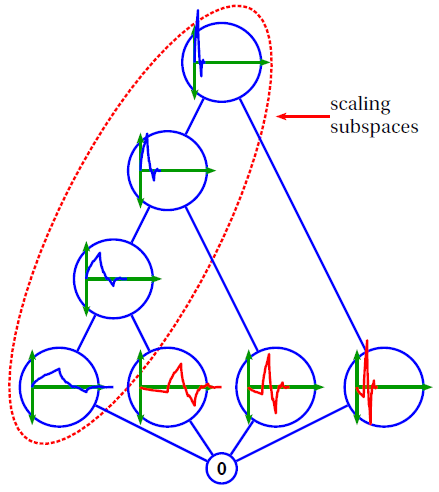
Daubechies-p2 wavelets.