Rayleigh Distribution
March 29, 2018
Getting Started
Power Spectral Density
Converting Recorded Data
Statistics & Probabilities
Test Control
Back to: Random Testing
There are several situations where Rayleigh distribution occurs in random vibration. The peak amplitudes of a resonance‘s response to a random excitation exhibit a Rayleigh distribution. The amplitudes of the spatial vibration patterns in complex systems also have a Rayleigh distribution.
The second example led John W. Strutt to derive the formula for the Rayleigh probability distribution. He considered the vibration amplitude to be a vector r with a and b components that are independent and normally distributed with a zero mean value and variance, σo 2.
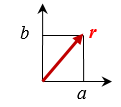
Equation 23 gives the normalized magnitude of r.
(1) ![]()
Equation 23
Equation 24 gives the PDF, which is displayed in Figure 3.19.
(2) ![]()
Equation 24
The Rayleigh PDF is not symmetrical, and the mean value is not equal to 1. Instead, r ≅ 1.25 σo and σr ≅ 0.655 σo.
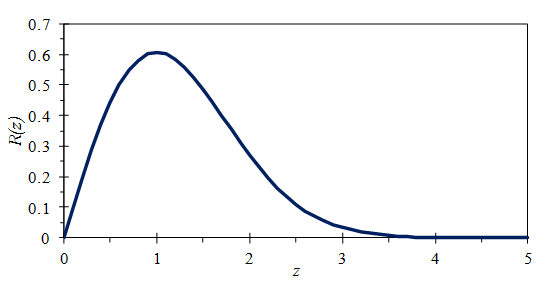
Figure 3.19. The Rayleigh distribution.
Example
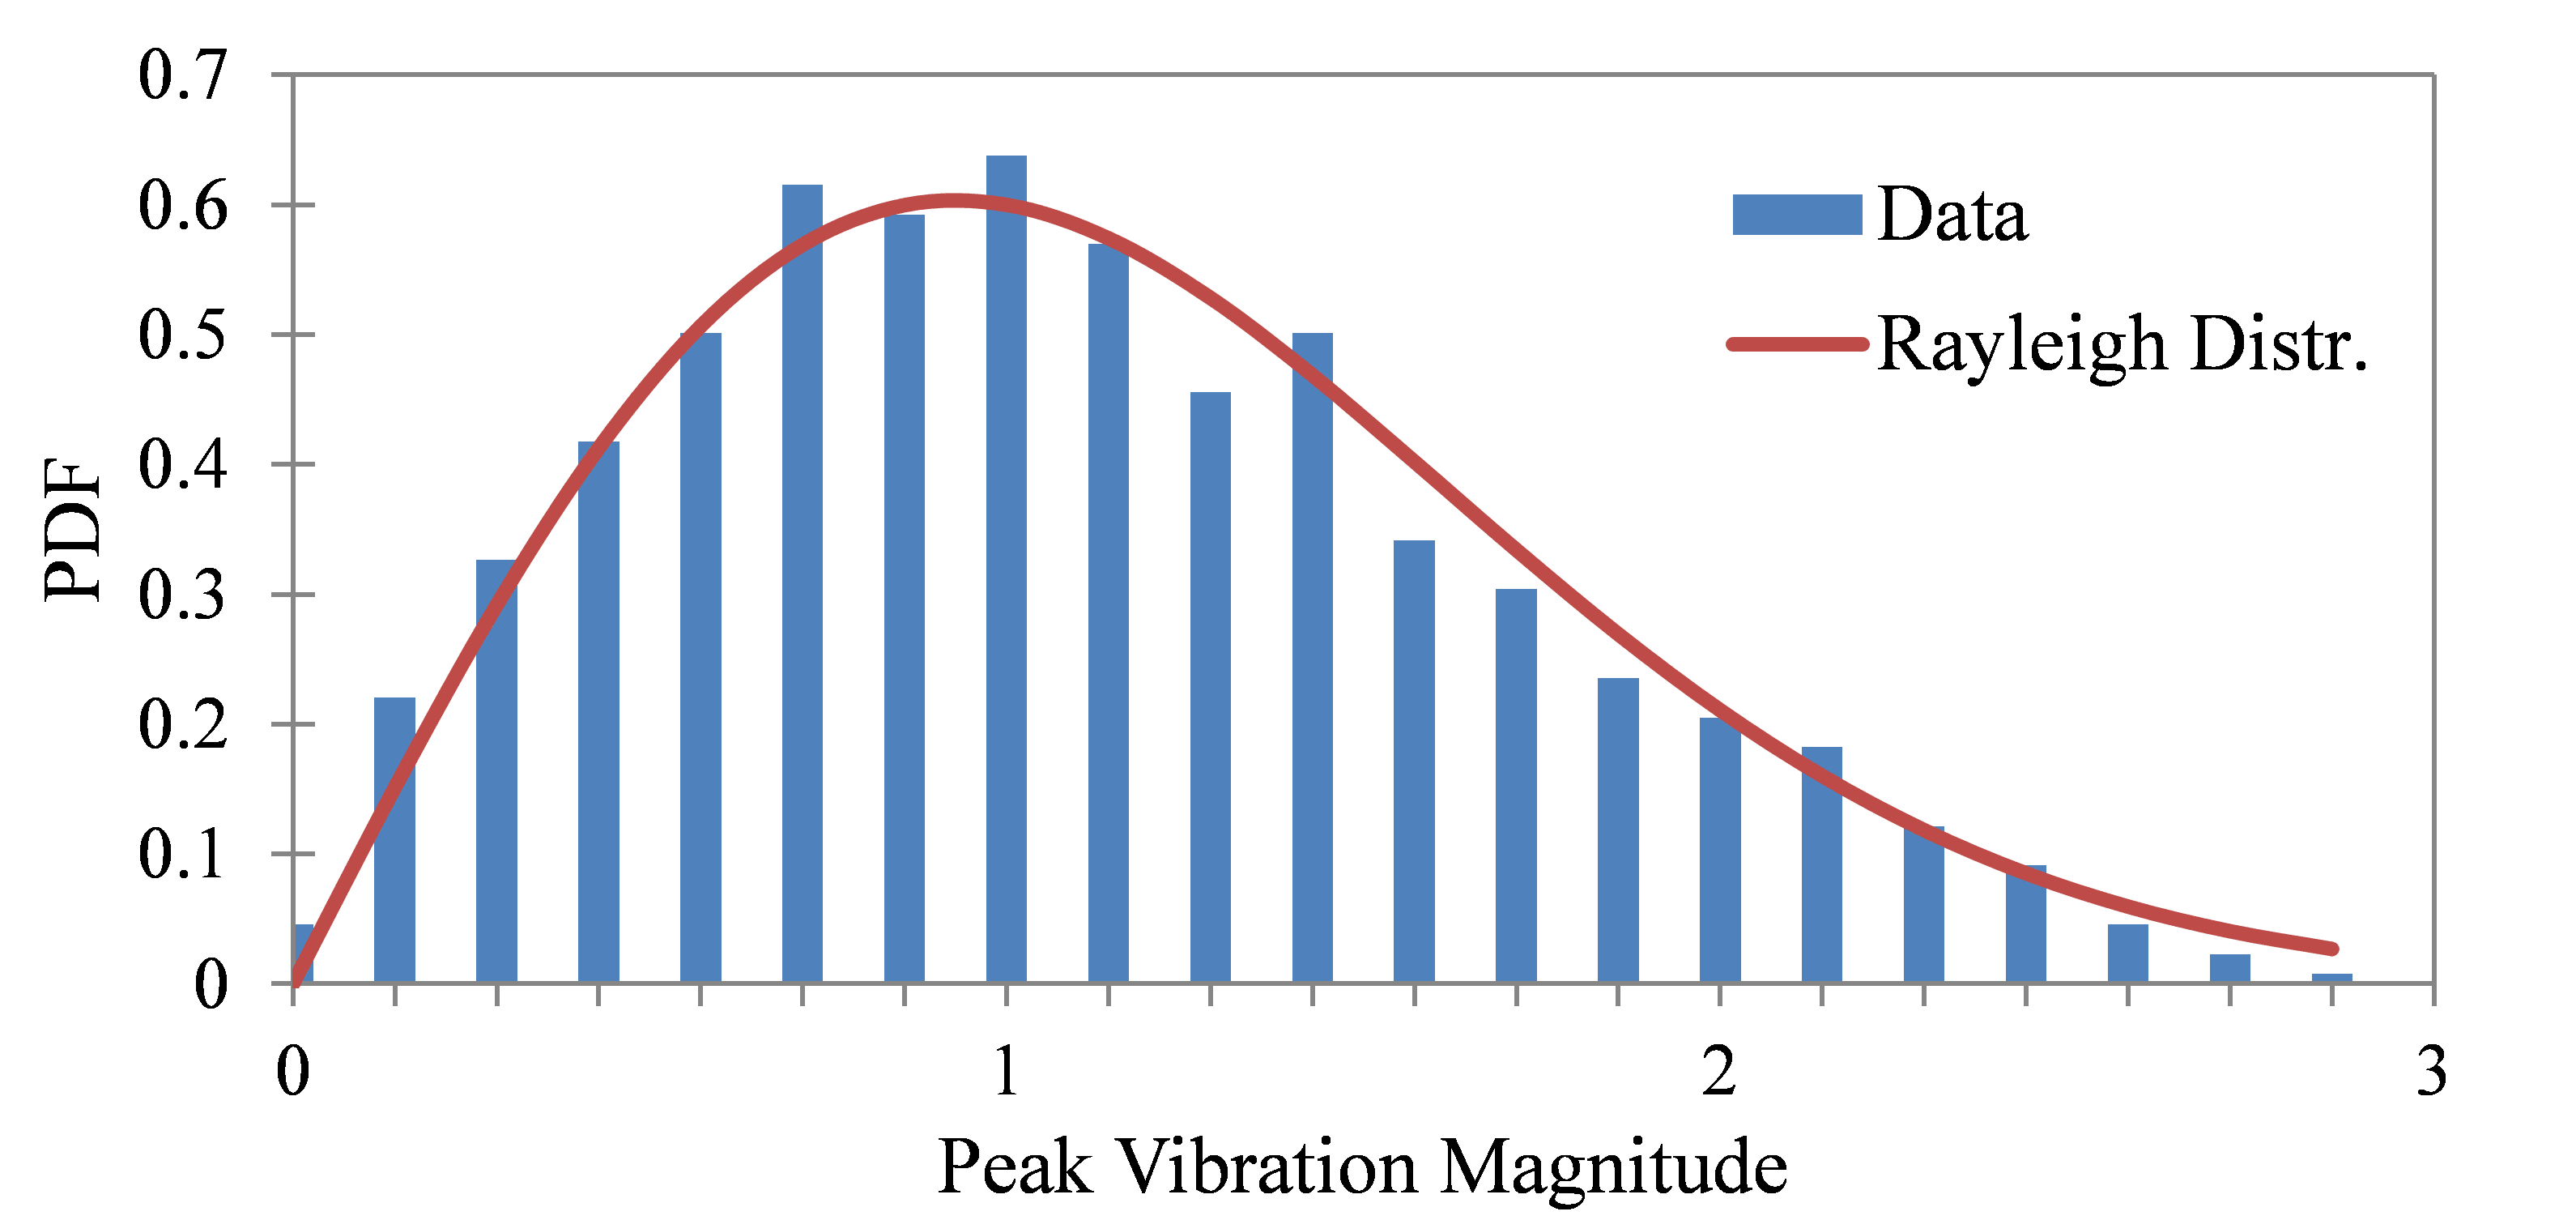
Figure 3.20 displays the vibration response of a cantilever beam’s resonance to random excitation at the base. Figure 3.21 compares the histogram of the peak magnitudes, |Ai|, to the Rayleigh distribution. The peak magnitudes are proportional to the peak stresses in the beam. Application-wise, engineers can use the results in fatigue analysis.

Figure 3.20. Random vibration response of the fundamental resonance of a cantilever beam.
Confidence Intervals
The Rayleigh distribution has a close association with the χ22 distribution because the Rayleigh variables are the square root of the χ22 variables.
(3) ![]()
The area P in the graph below displays the confidence level “not to be exceeded” for the peak level estimation. Figure 3.22 is a plot as a function of the number of standard deviations from the mean.
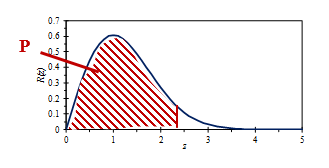
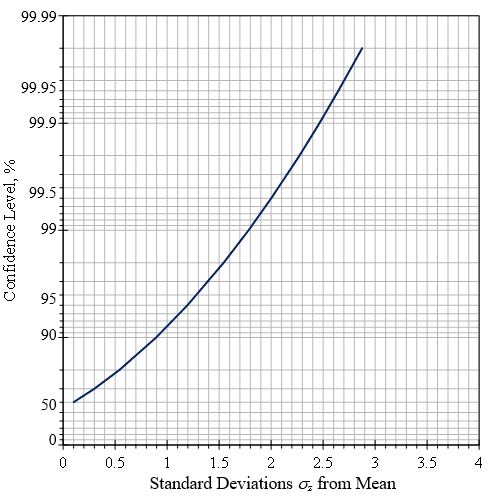
Figure 3.22. Confidence intervals for “not to exceed levels” with Rayleigh distribution.
