Objectives of Vibration Data Analysis
July 19, 2024
Initial Design
Data Analysis
Reporting
Back to: Making Sense of Test Data
As discussed in the previous lesson, engineers can perform various tests to define a device under test’s (DUT) initial design and develop a vibration testing plan. A “test” may include data acquisition in the field, design failure mode and effect analysis (DFMEA), a reliability test on a shaker in the lab, etc.
Analyzing test data can help identify root causes of resonance or failure, validate the test profile, affirm boundary conditions for digital twins, adjust acceleration factors for future testing, and more. This lesson highlights several objectives of vibration data analysis, particularly when defining an initial design and test plan.
Objectives of Vibration Data Analysis
- Identifying resonances and periodic patterns
- Determining operational limits
- Determining destruct limits
- Comparing data to real-world scenarios/extraordinary conditions
- Identifying/confirming appropriate test acceleration factors
- Providing credible inputs/confirming boundary conditions for digital twin analytical models
IDENTIFYING RESONANCES AND PERIODIC PATTERNS
Resonances
Engineers analyze resonances to understand how the DUT responds to stimuli such as mechanical forces or environmental conditions. Resonance occurs when a force acts on a DUT at the same frequency as its natural frequency, leading to increased vibration levels, rapid damage accumulation, and eventually, failure.
Resonances offer insight into a design’s structural stability and durability. Engineers can use them to identify areas prone to fatigue. Shifting resonances are also indicative of imminent failure.
Addressing resonance helps mitigate undesirable vibration levels, and engineers can make design changes to meet safety standards and other product requirements.
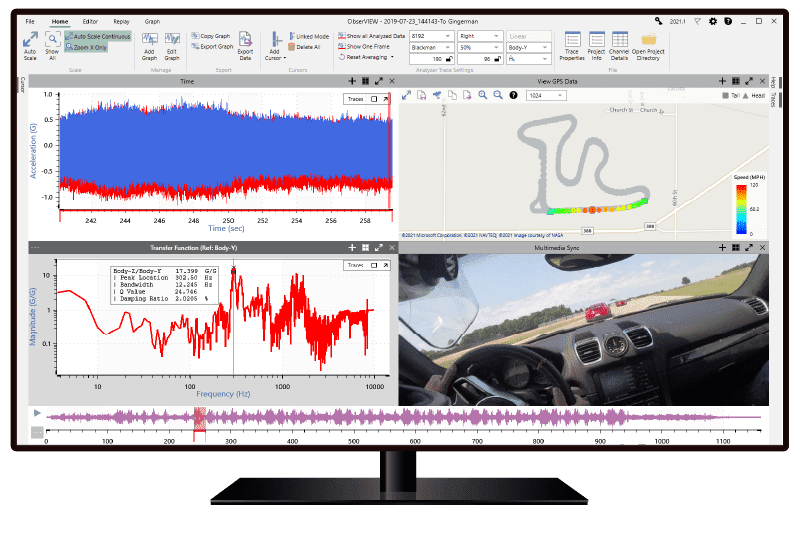
A sharp peak in a data’s frequency spectrum often indicates a resonance. The Data Analysis for Identifying Resonances lesson offers guidance on this type of analysis.
Periodic Patterns
Periodic patterns in vibration test data give insight into a DUT’s behavior under dynamic loading conditions. These patterns indicate that the DUT responds consistently to recurring stimuli, such as the rotation of an engine motor. Engineers can reference periodicity to identify natural frequencies and vibration modes, which help describe the DUT’s interaction with external forces.
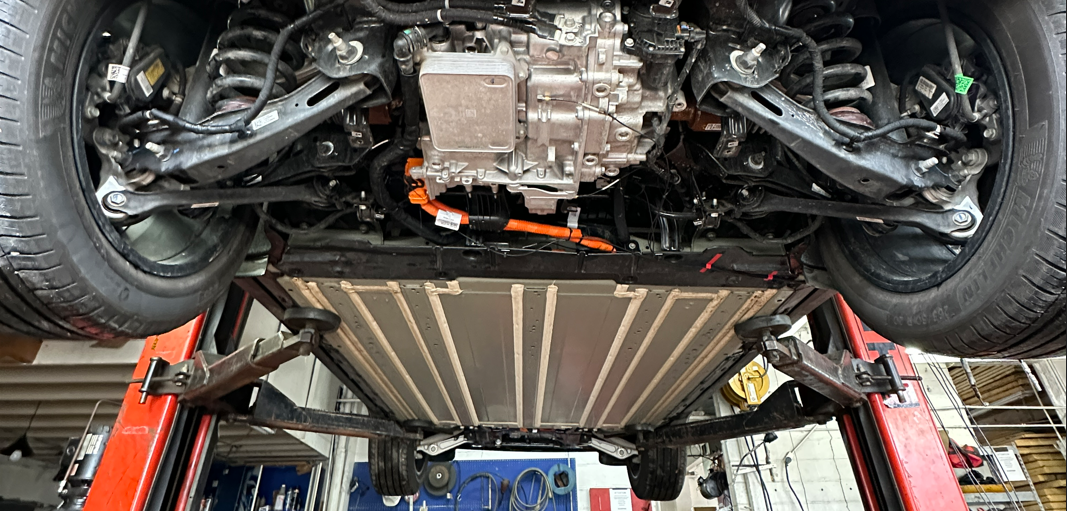
For example, in automotive engineering, periodic behavior in test data from a vehicle suspension system can point to the resonant frequencies at which the suspension components oscillate in response to road irregularities. By analyzing these periodic patterns, engineers can mitigate excessive vibrations, enhance ride comfort, and ensure vehicle durability and safety.
In time-domain data, periodic patterns may appear as repetitive fluctuations or oscillations in the signal. Transforming the data to the frequency domain helps identify the dominant frequencies corresponding to these patterns. Engineers can also examine the harmonics of these dominant frequencies to determine the source of the forcing function driving them.
DETERMINING OPERATIONAL LIMITS
Vibration test engineers want to identify weaknesses early on, allowing them to modify the design before the DUT enters mass production. Operating limits define the maximum stress that can occur before the DUT ceases to perform as intended.
Operating limits are determined by physical testing and differ from the design’s environment operational requirements. Safe operating limits are generally well below this threshold.
Engineers try to identify operational limits during highly accelerated life testing (HALT) or rapid failure mode precipitation testing (RFMPT™) to confirm models and design margins. Determining a DUT’s operational limits helps engineers optimize its design parameters. Operational limits also help ensure that a product complies with industry standards.
Vibration tests typically subject the DUT to varying frequencies, amplitudes, and durations to assess its response under different conditions. Often, engineers run the tests at various temperature extremes in a thermal chamber, as material properties and expansion/contraction can significantly affect a vibration environment. With the resulting data, they might:
- Identify the resonant frequencies
- Assess the vibration amplitudes across different frequency ranges, compare the amplitudes against predetermined values, and identify structural weaknesses or inadequate damping
- Analyze the DUT’s response across various frequencies, including magnitude and phase, to understand dynamic behavior
- Observe transient responses during startup, shutdown, or sudden changes in operating conditions; assess the response to abrupt changes in vibration levels to determine stability under dynamic loading conditions
- Evaluate the fatigue life based on cyclic loading and stress levels; assess the likelihood of fatigue failure over the intended product lifecycle, considering factors such as stress, material properties, and environmental conditions
Engineers may also consider environmental factors and regulatory requirements and compare the data with reference data, simulation results, or industry standards.
DETERMINING DESTRUCT LIMITS
Destruct limits represent the upper limits of vibration beyond which the product may experience irreversible damage or failure. Unlike operational limits, the DUT does not recover when the stress is removed.
Engineers typically determine destruct limits through destructive testing, where the test outputs progressively increasing vibration levels until the product fails without recovery when the vibration or other stress stops.
Destruct limits provide insights into the DUT’s structural integrity and ability to withstand extreme vibration-induced stresses. Engineers test for them to identify potential weak points or failure modes, assess structural robustness, and inform design improvements or corrective actions.
When determining destruct limits in vibration testing, engineers identify critical thresholds beyond which the product may experience permanent damage or failure. With the resulting data, they might:
- Monitor the amplitude to identify levels that may compromise structural integrity; sudden increases exceeding predefined thresholds indicate potential failure points
- Measure stress and strain levels in critical components; levels beyond material limits suggest potential areas of weakness
- Analyze frequency content to identify dominant frequencies and vibration modes that may contribute to structural fatigue or failure; perform spectral analysis to identify peaks in the frequency domain and assess their significance relative to structural integrity
- Confirm baseline analysis parameters for digital twins (i.e., material properties and structural boundary conditions)
COMPARING DATA TO REAL-WORLD SCENARIOS
Engineers can compare test data to real-world data to confirm whether the test was severe enough (i.e., the product will not fail in the field after testing) or, alternatively, not overly severe. More importantly, they can confirm that the frequency content of the test aligns with the end-use environment (EUE). The Correlating Test Data lesson discusses the comparison of data sets.
IDENTIFYING/CONFIRMING APPROPRIATE TEST ACCELERATION FACTORS
Engineers accelerate their test profiles to save time. The vibration test industry has introduced several methods of test acceleration, such as Vibration Research’s Fatigue Damage Spectrum software.
However, engineers can over-accelerate a test profile. Over-acceleration reduces test accuracy, often decreasing or removing critical vibration levels.
How can an engineer determine which acceleration level is “just right”? After running an accelerated test profile, they can analyze and compare the data to ensure sufficient vibration levels. With the resulting data, engineers:
- Assess the response to different acceleration levels and monitor amplitude to assess dynamic behavior under vibration loading
- Identify resonant frequencies and vibration modes and determine which frequency ranges include significant behaviors
- Assess the amplitude distribution across different frequency ranges and look for consistency with real-world levels across the relevant bandwidth
- Evaluate the stress and fatigue levels under different acceleration levels and estimate the stress distribution/fatigue life of critical components; ensure that the test profile adequately represents real-world loading conditions
- Compare the test data with field data or historical records to validate the selected test acceleration factors
- Verify that the test acceleration levels comply with relevant industry standards, regulations, or customer specifications and ensure that they meet required performance criteria and provide sufficient margin for safety and reliability
- Use a sampling plan for reliability testing to optimize overall use of test resources and assure compliance with product lifecycle reliability design requirements
By considering these factors during their analysis, engineers can identify and confirm appropriate test acceleration factors that effectively simulate real-world operating conditions without producing foolish failures, optimizing test time and ensuring product reliability.
PROVIDING CREDIBLE INPUTS/CONFIRMING BOUNDARY CONDITIONS FOR DIGITAL TWIN ANALYTICAL MODELS
A digital twin analytical model is a digital representation of the DUT that uses real-world data to simulate the DUT’s response throughout lifecycle management. Engineers analyze recorded data from the field and lab to validate model predictions.
Credible inputs refer to the test profile levels and are largely predicated on the industry.
- Will analysts or regulators accept the test profile levels?
- Have you applied all the necessary inputs to reflect the product’s response in the operational environment?
Answering these questions will help an engineer determine if their inputs are credible.
Engineers often conduct vibration tests on the DUT or a prototype to acquire empirical data on dynamic behavior. These test results serve as a benchmark for validating the digital twin analytical model’s predictions. By comparing the model outputs with experimental data, engineers can assess the model under different operating conditions.
Boundary conditions refer to the constraints used in the digital model. Engineers want to ensure the math correctly models the attachments (bolts, welds, etc.). The term “boundary conditions” comes from finite element analysis (FEA).
Engineers evaluate the boundary conditions defined for the digital twin model to ensure they accurately represent the operational environment. They may use field measurements, environmental monitoring, and system characterization techniques to validate the boundary conditions.