What is the PSD?
March 29, 2018
Back to: Random Testing
In vibration testing, the power spectral density (PSD) is a powerful analytical tool for understanding and characterizing random vibration. It estimates the distribution of a signal’s strength across a frequency spectrum.
Vibration test engineers can leverage the PSD in various ways to gain insight into the dynamic behavior of the device under test (DUT). Use examples include:
- Estimating stress levels and assessing fatigue life of critical components
- Comparing a test run to a test standard or multiple test runs
- Troubleshooting problems like component failure and assessing root causes
- Identify contributors to vibration energy and their frequency ranges
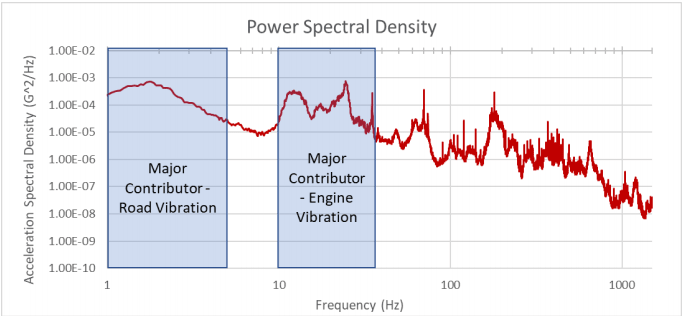
A PSD from transportation data with frequency ranges of known vibration sources.
In this lesson, we will break down the three pivotal elements of the PSD—power, frequency spectra, and density—and discuss the significance of mean-square values, frequency distribution, and normalization to a single hertz bandwidth.
Power, Spectra, & Density
Each word in “power spectral density” represents an essential component of the PSD.
Power: A signal’s mean-square value can represent its magnitude, meaning how far, on average, it strays from zero. The PSD displays a signal’s mean-square amplitude, or “power,” across a frequency spectrum. In this context, “power” refers to the distribution of signal energy over the frequency spectrum rather than a physical quantity, such as watts or horsepower.
Spectral: The PSD is a function of frequency. It represents the distribution of a signal over a spectrum of frequencies, similar to a rainbow that represents the distribution of light over a spectrum of wavelengths (colors).
Density: The magnitude of the PSD is normalized to a single hertz (Hz) bandwidth. For example, the PSD units for a signal with an acceleration measurement in unit G are G2/Hz. The PSD provides information about a signal’s power distribution over frequency. Normalizing it to a unit bandwidth (per Hz) allows engineers to compare signals acquired at different sampling rates or frequency resolutions.
The name power spectral density does not include the measured quantity, so engineers sometimes replace the word power with the name of the measurement. For example, they may refer to the PSD of an acceleration signal as the acceleration spectral density.
Why Power?
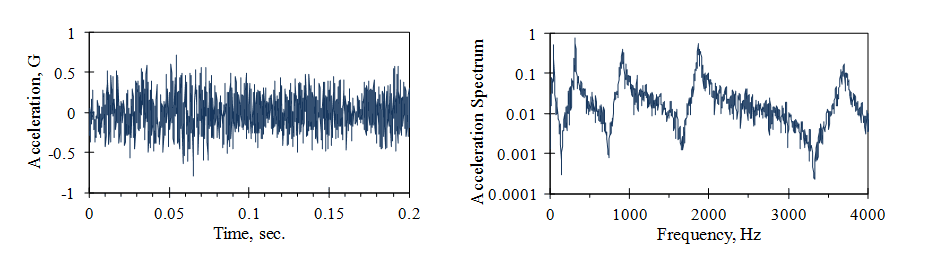
Figure 2.1. The vibration of a car floor panel.
The PSD plot can be created by an infinite number of waveforms, but when a PSD is defined, the RMS will not change. This consistency allows engineers to match a PSD to a specification and determine if the RMS is as required. They can also use the RMS to compare two PSD plots and verify that they measure the same amount of energy.
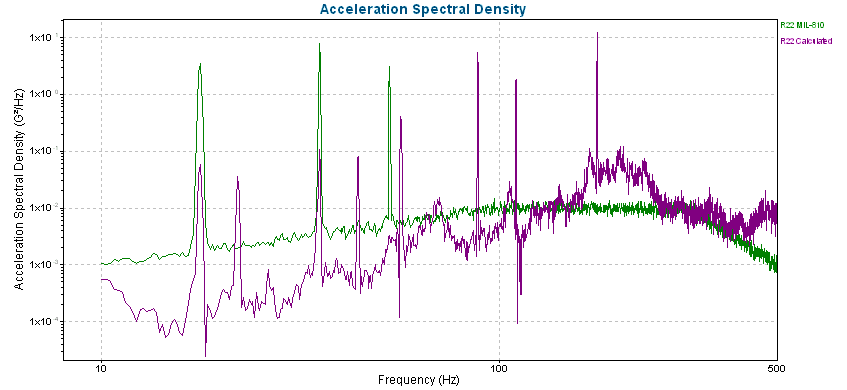
Comparison of calculated PSD and test standard PSD for helicopter vibration.
Note: for more information on RMS, consider reviewing the following resources: Random RMS Calculator Tutorial.
Signals of Different Frequencies
We use the mean-square value to combine signals of different frequencies. For example, Figure 2.2 displays the summation of two sine waves with different frequencies. The mean-square value of the unit sine wave is 0.5, and the RMS value is 0.707. After the two waveforms are summed, the mean-square value is 1.0, and the RMS value is 1.0.
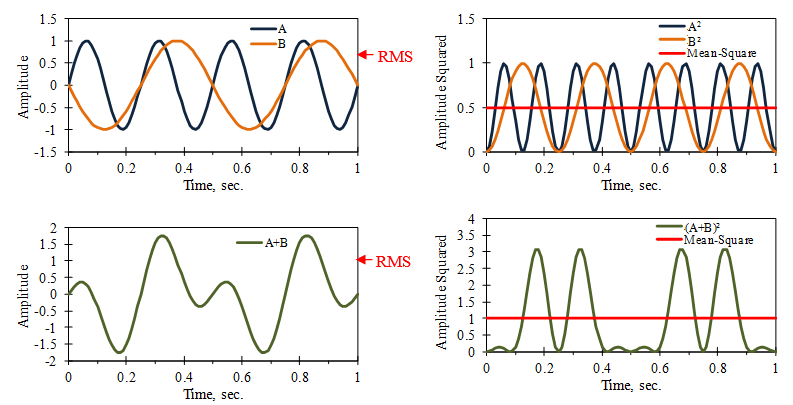
Figure 2.2. The mean square value of A+B equals the sum of the mean squares of A and B, where the mean values of A and B equal zero.
Mathematically, this is a general result for two independent variables A and B. The square of the sum is (A+B)2 = A2 + 2AB + B2. If the two variables are independent and have a mean value of zero, then the mean value of 2AB is also zero (Figure 2.3).
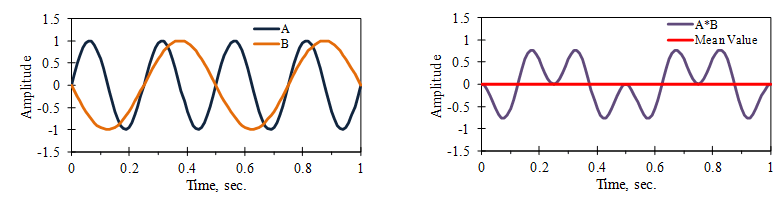
Figure 2.3. The mean value of 2AB.
There are cases where the PSD is represented by the square root of its computed value. Therefore, an acceleration PSD may have units G/(Hz)1/2. Make sure to determine the PSD units.
Why Spectral?
The frequency distribution of a signal provides useful information when dealing with system resonances. Peak amplitudes on a time-domain vibration signal are not as easy to interpret. In Figure 2.4, a cantilever beam was driven at the base by a broadband signal, which has a wide distribution of frequencies. An accelerometer measured the tip vibration.
It is difficult to determine the beam’s resonant frequency values from the signal’s time history (left). However, the peaks in the tip vibration’s frequency spectrum clearly show these values (right).
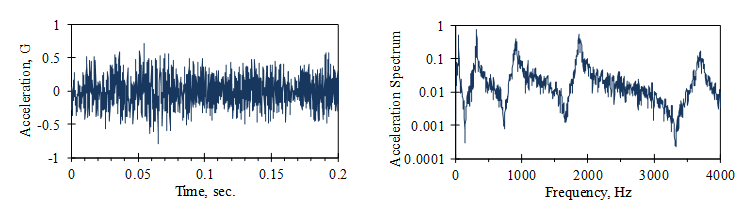
Figure 2.4. Time history and frequency spectrum of beam vibration signals.
Why Density?
The magnitude of a signal’s frequency distribution is determined by its amplitude at each frequency component, reflecting the signal’s energy distribution across the frequency spectrum.
In Figure 2.5, the frequency spectrum of a car vibration signal is computed with three different frequency resolutions or bandwidths. The squared magnitudes of the spectrum are influenced by the width of the frequency bins. To overcome this variation, the PSD computation divides the squared magnitude by the sample rate to provide a consistent value independent of the frequency bandwidth.
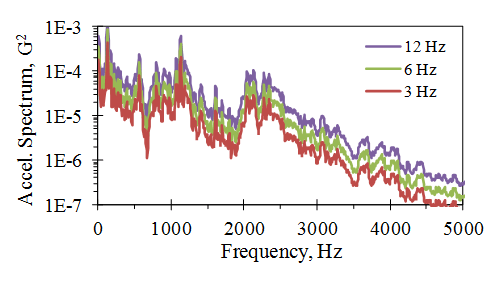
Figure 2.5. Dependence of the frequency spectrum on the frequency bandwidth.
There are cases where individuals confuse the bandwidth-dependent frequency spectrum and the PSD. A bandwidth-normalized magnitude is a feature of the PSD calculation.