Correlating Test Data to Standards, Real-world Data
July 22, 2024
Initial Design
Data Analysis
Reporting
Back to: Making Sense of Test Data
Standards for vibration testing provide a test profile or guidelines for selecting test values. In this regard, the preparation is less involved than building a test plan from scratch. However, it is still beneficial to define the purpose of your vibration test if replicating a test profile from a standard.
Ideally, an engineer performs a design failure mode and effect analysis (DFMEA) early in the product development cycle. In doing so, they can anticipate the data to be collected and have a plan in place if the device fails under test. This extra step also helps to ensure the correct equipment/fixturing is used.
If the engineer is looking for the device to pass the vibration test and nothing more, they need only compare the test results to the standard. However, keep in mind that standards do not claim to reflect real-world conditions and may over/under-test a device, leading to additional cost and lost time unnecessarily re-designing a part. Worse yet, they may overlook true failures.
Engineers can compare test data to real-world data to confirm that the test profile is severe enough/not overly severe (i.e., the product will not fail in the field after testing). More importantly, they can confirm that the frequency content of the standard aligns with the end-use environment (EUE).
Comparison to Real-world Data
When comparing two data sets, engineers should be mindful of which values they’re using. Let’s consider the test’s end goal. In many situations, vibration testing confirms that a product can withstand the EUE for an acceptable lifetime of use. If the engineer compares the random test acceleration data from a laboratory shaker test to data acquired in the EUE, they may reach a conclusion about amplitude levels. However, this comparison will not tell the engineer if the shaker test generates the same damage fatigue as the EUE. As such, they cannot accurately judge the severity of the shaker test with this information.
Two data plots provide information on test severity and fatigue accumulation: the power spectral density (PSD) and fatigue damage spectrum (FDS).
Power Spectral Density
Many test standards for random vibration define the test profile as a PSD. As stated in the previous lesson:
“The PSD is a statistical estimation of a signal’s distribution of power over a defined spectrum. The RMS [root mean square] of a PSD measures the spectrum’s overall random vibration acceleration. Generally, it is an accepted metric for average test intensity.”
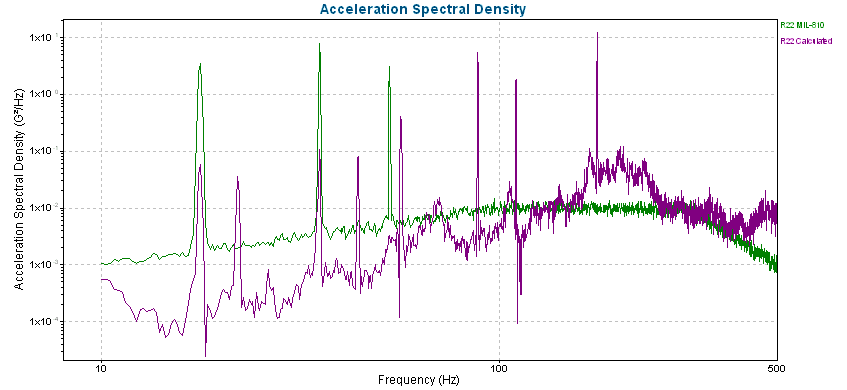
Comparison of test standard and field data-generated profile.
Comparing the PSD of test data to that of the EUE can inform engineers if the shaker test is of an acceptable intensity. However, it leaves the question of how long (in time) to run the PSD to reflect the design life of the product in the EUE. The FDS can solve this problem.
Caveat
An electrodynamic shaker provides a stationary, random spectrum with a near-constant PSD. As such, the PSD is a valid representation of the entire test’s distribution of power, and engineers can use it as a metric for comparison. However, if one of the comparison excitation spectra is not uniform, an engineer may consider the FDS. As previously stated, the FDS can relate PSD comparisons, provided the time basis for each is known.
Fatigue Damage Spectrum
Vibration test engineers use the FDS for accelerated test development. The FDS combines multiple time-history recordings and weighs them based on their contribution to the life of the product in the EUE. The resulting test is the damage equivalent to the product’s lifespan. To be a valid metric, the engineer must understand the DUT’s application in the EUE and the application’s severity.
The RMS is a broad-spectrum intensity measurement, providing a snapshot of the test spectrum at a specified time without the frequency content. It does not account for the spectrum’s frequency or amplitude distribution or differences in peak acceleration and kurtosis.
The FDS accumulates over a test’s duration and represents the entire sequence of events. The accumulated FDS of multiple step stresses to failure provides the total damage accumulated to achieve the failure mode. This overall fatigue damage can function as a demand line for future product revisions to determine if product changes were successful. If the engineer mounts a product at different locations on a table or uses different tables, the time to failure may differ, but the accumulated fatigue will remain a valid comparison.
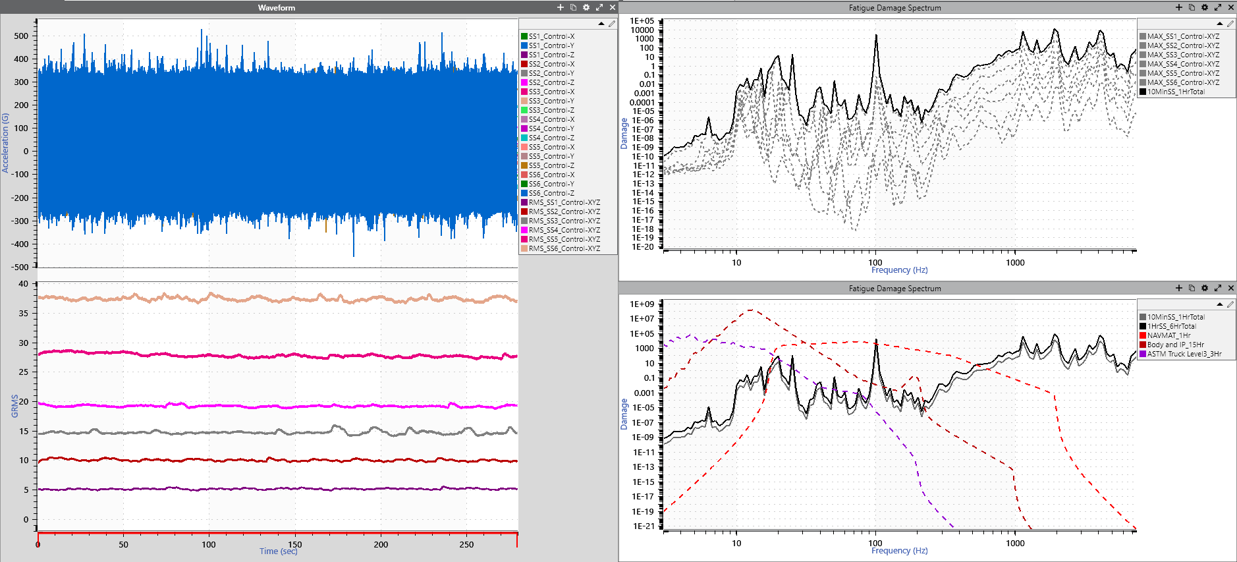
Comparison of fatigue damage of different test specifications.
The HALT Vibration Testing and FDS course discusses FDS as a control metric for highly accelerated life testing (HALT).
Should I Use a Standard or Custom Test Profile?
At the start of the product development cycle, engineers may ask: should I use a pre-defined test profile or build one from field data? The answer depends on the lab’s resources, the quality of industry documentation, and the DUT, among other factors. The more unique or costly the product, the more necessary customization becomes.
Standard Profile
Standard (pre-defined) test profiles are best for generic components that have multiple applications. For example, a standard test profile may serve its purpose for electrical connections used for assembly in several locations in the product.
Test standards are a valid option, and several industries have well-developed, long-standing test methods. However, generic test profiles are not tailored to a specific DUT and can lead to misleading results and costly failures in the field. As such, they provide ambiguous information about the test’s relation to product use, EUE, and failure modes. We recommend weighing the importance of precision against the convenience of a standard test profile.
Many test standards are well-established in their respective industry, which allows for easy historical comparisons. If an issue occurs down the line, tests run with a standard profile may be easier to defend in court as an “industry standard.” At the same time, a custom profile demonstrates that the manufacturer was following “due diligence” to protect the safety of its customers and meet contractual durability obligations.
Custom Profile
Custom test profiles are preferable if sufficient product maturity or surrogate data are available. Engineers can use the test data to answer questions about the relevance of the test as it relates to product use, EUE, and failure modes. Custom profiles also lead to more robust designs over time because the engineer is better able to identify product-specific failures. It may be easier to defend in court as it is specific to the product and application.
A custom profile reduces the potential for unanticipated warranty costs. It also allows the product to move faster to market because the development cycles are reduced.
Sampling Plans
Regardless of a standard or custom profile, the engineer should be aware that a comprehensive testing plan involves more than one sample/life test. A sampling plan ties an EUE-correlated test to a reliability requirement and allows tradeoffs between the quantity of DUT on test versus the overall test time. The Vibration Sampling Plans webinar discusses this topic in detail.